Energy
Current Use
Energy Consumption and Demand
In this plan, energy is divided into three sectors: electricity, transportation, and thermal. This section focuses on the amounts used in total units. The numbers presented are the most accurate estimates based on current information sourced from the American Community Survey, Department of Labor, the Vermont Agency of Transportation, Efficiency Vermont, Drive Electric, and the Energy Information Administration. The discussion of this data serves is the context for the energy plan; it is the starting point from which the Region will progress to achieve the goal set out in the Vermont Comprehensive Energy Plan (CEP) of 90% renewable by 2050 (90x50 Goal).
Note On Energy Terminology
A significant technical note should be made here, and that is the distinction between energy measured at the point of consumption, called “end-use,” and energy measured as generated, called “primary-use.” End energy use is measured at the point of use, as it enters—or is delivered to—the consumer’s home, building or vehicle. Primary energy use includes the delivered energy plus the energy that is lost in generation, transmission and distribution. This is especially important in the case of electric generation because thermal power plants can shed up to two units of heat energy for every one unit of electric energy that is produced. End-use consumption is the measure most often used in reports of energy use because it provides a better baseline for comparison. It will be referenced here when that data is available.
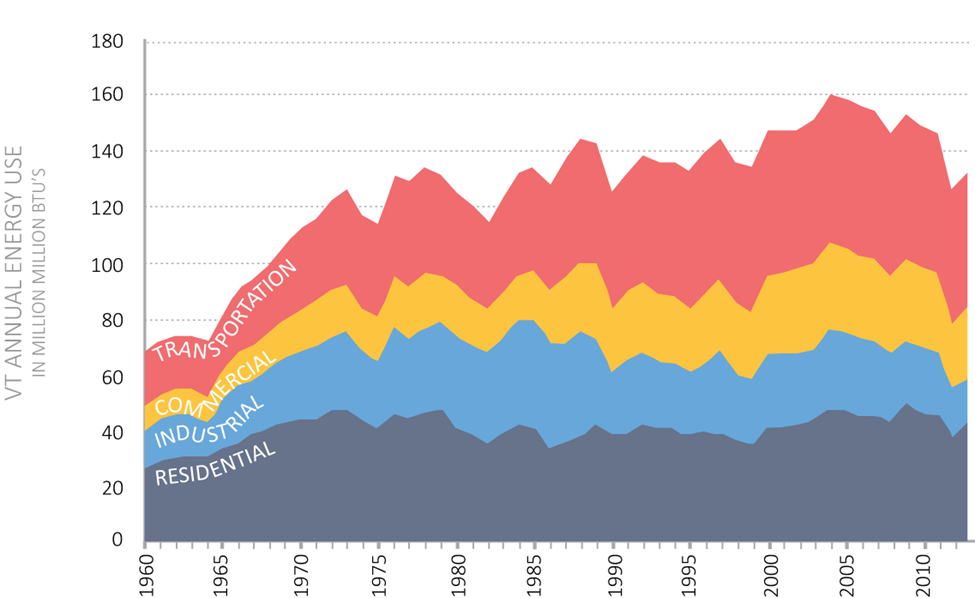
FIGURE 1: HISTORIC ENERGY USE IN VERMONT BY SECTOR 1
Growth and Energy Use
Over the last 80 or so years, both the State of Vermont and the Windham Region have drawn energy from multiple sources, primarily gasoline, liquid petroleum gas, and wood. Overall consumption throughout the 20th century has increased dramatically, with some decline around the “Great Recession” of 2008 (see Figure 1).
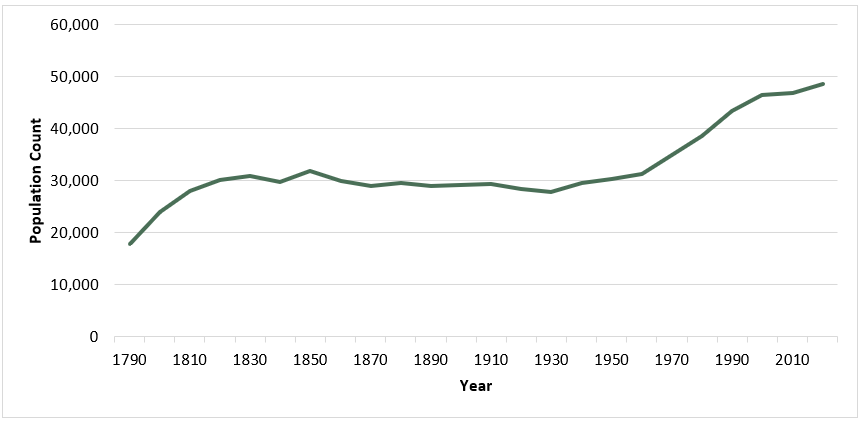
Energy consumption has generally tracked with population growth. While still a rural state, the period of 1790 to 1830 saw significant growth within the Windham Region, which then leveled off for more than a hundred years until around the 1950s, when resort development and an in-migration known as the “back to the land movement” started a boom in population growth that has steadily increased through the 2020 Census. Figure 2 below shows the Windham Region’s population over time.
FIGURE 2: WINDHAM REGION POPULATION, 1790 – 2020 2
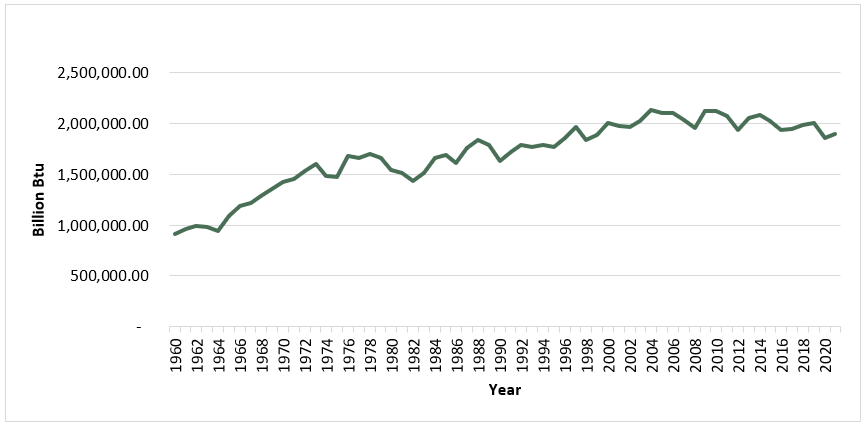
Overall energy demand in Vermont has grown from 916,422 Billion Btu in 1960 to its peak of 2,126,482 Billion Btu in 2009, a 43.1% increase. Since 2009, the demand has fluctuated with an overall decrease to 1,901,952.22 Billion Btu in 2021 (See figure 3).
FIGURE 3: TOTAL END-USE ENERGY CONSUMPTION ESTIMATES IN VERMONT, 1960-2020[3]
Economic activity in the Region has mirrored the population trends, and is another indicator of energy consumption within the Region. Additional employment, industrial output, and higher wages typically increase the demand for energy resources; however, the Vermont economy has been able to accommodate additional (real) economic growth with relatively steady energy input.
Windham Region Current Energy Use and the Cost of Energy
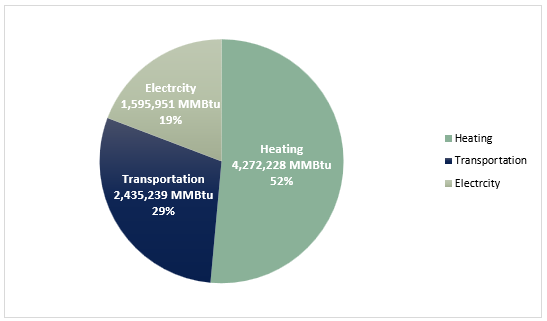
In 2023, the Windham Region consumed 8,301,324 Million Btu (MMBtu) across the electricity, heating, and transportation sectors (Figure 5). With each of the three sectors depending heavily on fossil fuels as the primary energy source, a majority of these dollars leave the state and local economy.
FIGURE 5: ENERGY CONSUMPTION IN THE WINDHAM REGION, BY SECTOR [4]
The economic cost of energy to individuals, as well as public and private entities, is one of the biggest concerns expressed about energy consumption in Vermont. During the Vermont Public Service Department’s (PSD’s) 2022-2023 public engagement process for reviewing Vermont’s renewable energy policies and programs, energy affordability and reliability were the number one concerns for residents. Every person and business in Vermont need to be able to afford electricity, transportation access, and heat at prices that they can afford, and cost is an important factor to consider during our Region’s transition to a more reliable, renewable energy future. As important as the cost of energy is, it is also variable and harder to build energy targets around. This plan will focus on amounts consumed as a way to track energy usage.
Electricity
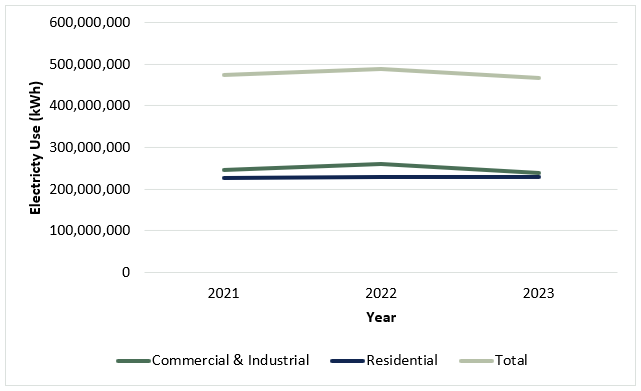
Efficiency Vermont has compiled electrical usage data from Vermont distributors Vermont since 2014 and reported on regional usage to the Regional Planning Commissions. Since 2014, the highest total amount of electricity used in the Windham Region was in 2016 at 502,864,000 kWh. Since that time, there has been some fluctuation in total usage for the region, but the overall trend has been a decrease. In 2023, the year of the latest data report, total usage was 467,727,049 kWh, a decrease of 6.9% from 2016.
FIGURE 6: ELECTRICITY USE IN THE WINDHAM REGION BY YEAR AND CATEGORY, 2021 - 2023[5]
EXISTING GENERATION FACILITIES
The Windham Region has a robust history of harnessing its natural resources to generate electricity. The Region has an installed generation capacity of 189.4 MW. Based on this capacity figure, it is estimated that 623,819 MWh are produced annually across 1,300 solar sites, 14 wind sites, 6 bio-generation sites, and electricity-generating dams on almost every major waterway.[6] The following two tables provide a town by town breakdown of the existing generation facilities in all 27 towns in the Windham Region.
Table 1: Installed Generation Capacity of Renewables in windham region Towns (MW)
|
Town |
Solar |
Wind |
Biomass |
Hydro |
|
Athens |
0.11 |
0 |
0 |
0 |
|
Brattleboro |
11.09 |
0 |
1.89 |
0 |
|
Brookline |
0.18 |
0 |
0 |
0 |
|
Dover |
0.92 |
0 |
0 |
0 |
|
Dummerston |
1.02 |
0 |
0.14 |
0 |
|
Grafton |
0.51 |
0.00 |
0 |
0 |
|
Guilford |
2.20 |
0 |
0 |
0 |
|
Halifax |
0.22 |
0 |
0 |
0 |
|
Jamaica |
0.68 |
0.01 |
0 |
2.41 |
|
Londonderry |
1.48 |
0 |
0 |
0 |
|
Marlboro |
0.33 |
0.00 |
0 |
0 |
|
Newfane |
0.95 |
0 |
0 |
0 |
|
Putney |
3.34 |
0 |
0 |
0 |
|
Readsboro |
0.12 |
0 |
0 |
0 |
|
Rockingham |
2.45 |
0.01 |
0 |
41.29 |
|
Searsburg |
0.01 |
36.00 |
0 |
0 |
|
Somerset |
0 |
0 |
0 |
0 |
|
Stratton |
0.11 |
0 |
0 |
0 |
|
Townshend |
0.88 |
0.01 |
0 |
0.96 |
|
Vernon |
0.87 |
0 |
0 |
32.40 |
|
Wardsboro |
0.11 |
0 |
0 |
0 |
|
Westminster |
6.20 |
0 |
0.45 |
0 |
|
Weston |
0.42 |
0 |
0 |
0 |
|
Whitingham |
0.25 |
0.01 |
0 |
33.60 |
|
Wilmington |
1.09 |
0.02 |
0 |
0 |
|
Windham |
0.08 |
0 |
0 |
0 |
|
Winhall |
4.61 |
0.00 |
0 |
0 |
|
REGIONAL TOTAL |
40.2 |
36.1 |
2.5 |
110.7 |
table 2: Annual electricity production in windham region Towns (MW)
|
Town |
Solar |
Wind |
Biomass |
Hydro |
|
Athens |
150 |
0 |
0 |
0 |
|
Brattleboro |
14,573 |
0 |
11,589 |
0 |
|
Brookline |
240 |
0 |
0 |
0 |
|
Dover |
1,203 |
0 |
0 |
0 |
|
Dummerston |
1,345 |
0 |
871 |
0 |
|
Grafton |
675 |
4 |
0 |
0 |
|
Guilford |
2,889 |
0 |
0 |
0 |
|
Halifax |
291 |
0 |
0 |
0 |
|
Jamaica |
891 |
19 |
0 |
10,539 |
|
Londonderry |
1,947 |
0 |
0 |
0 |
|
Marlboro |
440 |
2 |
0 |
0 |
|
Newfane |
1,245 |
0 |
0 |
0 |
|
Putney |
4,387 |
0 |
0 |
0 |
|
Readsboro |
154 |
0 |
0 |
0 |
|
Rockingham |
3,217 |
17 |
0 |
180,828 |
|
Searsburg |
18 |
70,956 |
0 |
0 |
|
Somerset |
0 |
0 |
0 |
0 |
|
Stratton |
140 |
0 |
0 |
0 |
|
Townshend |
1,153 |
19 |
0 |
4,200 |
|
Vernon |
1,142 |
0 |
0 |
141,912 |
|
Wardsboro |
146 |
0 |
0 |
0 |
|
Westminster |
8,147 |
0 |
2,759 |
0 |
|
Weston |
553 |
0 |
0 |
0 |
|
Whitingham |
322 |
13 |
0 |
147,168 |
|
Wilmington |
1,434 |
44 |
0 |
0 |
|
Windham |
104 |
0 |
0 |
0 |
|
Winhall |
6,064 |
4 |
0 |
0 |
|
REGIONAL TOTAL |
52,870 |
71,078 |
15,220 |
484,651 |
DISTRIBUTION UTILITIES
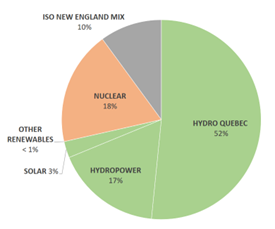
Vermont distribution utilities source their electricity through generation and purchasing to meet demands. Figures 7 and 8 show Vermont’s electricity characteristics. Figure 7 shows the electricity Vermont utilities generated and bought to meet demand. Figure 8 shows how renewable Vermont’s energy is based on retired renewable energy certificates. Charts were provided by the Vermont Department of Public Service. [7].
FIGURE 7 - VERMONT’S RENEWABLE GENERATION AND PURCHASE ENERGY MIX
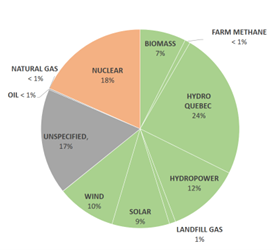
FIGURE 8 - VERMONT’S RETIRED RENEWABLE ENERGY CERTIFICATES
Vermont has several policies and programs that address renewable and clean energy in the state. Additional information can be found on the public service department website about the state policies and programs that address renewable electricity and the transitions required to achieve state energy and climate goals, as laid out in the 2022 Comprehensive Energy Plan (CEP) and the 2021 Climate Action Plan (CAP).
Vermont electricity distribution utilities purchased over 5.8 million MWh of electricity to meet the demand of Vermont consumers in 2021. Of this, approximately 64% came from renewable resources and about 18% came from carbon free resources. In 2021, Vermont distribution utilities also retired just over 4 million MWh in renewable energy certificates to meet the utilities’ requirements under Vermont’s Renewable Energy Standards. Of the retired credits, 72% was accounted for as renewable and, if nuclear is included, 90% of it was low-carbon.[8]
The Windham Region is serviced by two electricity distribution utility companies: Green Mountain Power and Jacksonville Electric Company. Green Mountain Power cover the majority of the Windham Region and Jacksonville Electric’s service area is the Village of Jacksonville and the Town of Whitingham.
ELECTRIC TRANSMISSION
The Vermont Electric Power Company, Inc. (VELCO) manages the safe, reliable, and cost-effective transmission of electric power throughout Vermont, and is a part of the integrated New England regional network. VELCO updates its Long-Range Transmission Plan every 3 years. The 2024 Long Range Transmission Plan highlights that peak demand is forecasted to grow significantly due to accelerating electrification of the heating and transportation sectors. While the transmission system has sufficient capacity to serve expected future demand for the first 10-years of the 20-year planning horizon, the Plan identifies several challenges that will need to be addressed:
- Substantial infrastructure investments will be necessary to meet future electrical demand–these will either come in the form of traditional grid upgrades (build out of transmission infrastructure, line rebuilds, transformer capacity enhancement, etc.) or alternative approaches, like increased energy efficiency, storage solutions, and smart grid technologies.
- Currently, distributed generation (DG) projects are reviewed on a project-by-project basis without regard to transmission system impact. To prevent further stressing transmission and distribution systems, carefully coordinated statewide planning is required to successfully integrate future distributed generation and storage without significant grid reinforcements.
- There are sub-transmission scale reliability issues (categorized as causing high or low voltage, or a thermal overload in which equipment exceeds its rate temperature).
As distribution utilities prepare for increased electrification, coordination between VELCO, the utilities, the Region, and municipalities will be increasingly vital to ensure that Vermont can meets its energy goals, minimize negative impacts to natural resources, maximize benefits to Vermonters, and prioritize those who have been disproportionately burdened by energy costs and reliability issues
Transportation
As Vermont is a rural state, car dependency is not only a social norm but a necessity in most cases. The land use pattern of dispersed settlements encourages car usage by creating long distances between destinations. In Windham County, the average travel time to work in 2022 was 22.2 minutes[9]. Most of these trips were with vehicles with a single occupant. Transportation consumes a large portion of the total petroleum used, and has steadily increased since the 1960’s, though the trend is now leveling off.
FIGURE 9: ESTIMATED TRANSPORTATION ENERGY CONSUMPTION BY FUEL TYPE IN VERMONT, 2019
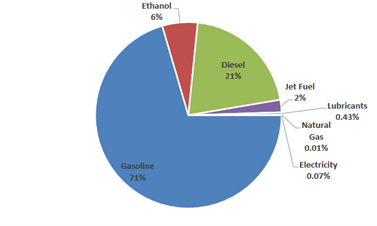
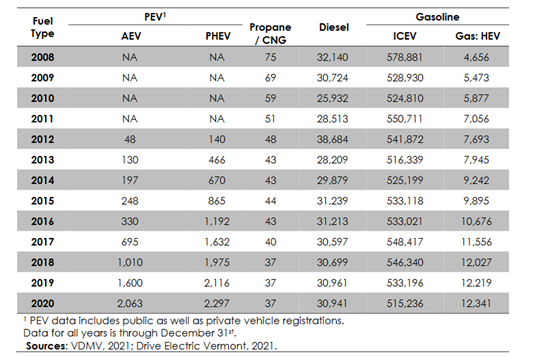
When looking at the total number of registered private vehicles in the State, gasoline and diesel-powered vehicles greatly outnumber the number of plug-in electric vehicles (EVs). There has been consistent growth in the number of gasoline-powered hybrid electric vehicles (GHEVs), plug-in hybrid electric vehicles (PHEVs), and all-electric vehicles (AEVs) over recent years. However, the overall small percentage of this vehicle type does little to offset the substantial percentage of vehicles fueled by gas and diesel. Fuel efficiency of these classifications of vehicles has a direct impact on the amount of fuel used by the residents of the Region.
FIGURE 10: PRIVATE VEHICLES REGISTERED IN VERMONT BY FUEL TYPE, 2008-2020[10]
According to data from Drive Electric, Electric Vehicle registration in the Windham Region has steadily increased between 2021-2023. This mirrors Vermont’s trend, but in order to meet future goals, this rate of increase will have to be even greater than the past few years.
Table 3: Electric vehicle registration in the windham region, 2021 - 2023[11]
|
Vehicle Type |
2021 |
2022 |
2023 |
|
All Electric |
245 |
316 |
497 |
|
Plug in Hybrid |
289 |
358 |
436 |
|
Total |
534 |
674 |
933 |
INDIVIDUAL VEHICLE MILES
In the Windham Region, transportation accounts for 29% of total energy consumption (Figure 5). The leading fuel for transportation is gasoline followed by distillate fuels (diesel). Because transportation-related energy use is mainly determined by the individual vehicle miles traveled by residents and visitors, addressing fuel consumption via the personal vehicle is a priority. Recently, fuel efficiency improvements have gained traction as a public policy issue. These gains in fleet efficiency, however, may be offset when total vehicle miles traveled increases faster than the population grows, since total petroleum consumption is still increasing.
Vehicle Miles Traveled (VMT) is an estimate of total miles driven by all vehicles on a road network. Factors affecting VMTs include how far vehicles go, frequency of trips, and number of people in a vehicle. According to the Federal Highway Administration, between 2008 and 2020 Vermont consistently ranked higher in VMTs per capita than the national per capita average number of VMTs. This is mostly due to Vermont’s rural character. For 2020, Windham County accounted for 507.193 (in millions) VMTs. The entire state of Vermont came in at 5,990.6 (in millions) VMTs. Windham County contributes to 8.5% of Vermont’s VMTs. Windham County has 6.74% of Vermont’s population and accounts for a higher percentage of VMTs.
The Public Service Department’s Municipal Consumption Tool was used to generate estimates for transportation sector energy use in the Windham Region. To account for the higher amount of VMTs per capita in the Windham Region, the average annual VMTs is assumed to be 13,250 VMTs compared to the state average of 12,500 VMTs. According to the 2023 American Community Survey (ACS), the Region has 20,680 primary housing units (not vacant or used for seasonal/recreational purposes). Based on the number of households, it can be estimated that there are 34,424 light-duty vehicles (LDV), which consume 18,785,147 gallons of fossil fuel each year. The total amount of energy consumption for internal combustion engine vehicles is calculated to be 2,435,239 MMBtu.
FUEL EFFICIENCY
Fuel efficiency has increased over time, but the overall average miles per gallon (mpg) rate in the U.S. peaked in the late 1980s and then began declining. This downward trend should see a reversal in response to the Federal fuel efficiency standards of 2011, which required a 35.5 mpg average for the U.S. auto industry by 2016. Although this new standard would only affect cars built after that time, the potential exists for it to have an impact on the overall efficiency of the State’s current vehicle fleet. The majority of the vehicle fleet in Vermont fell within the 21-27 mpg efficiency range based on the vehicles registered in 2021. This range is likely lower than the federal fuel efficiency standards due to the overall age of the vehicles currently on the road, and that 15% of the Vermont registrations could not be matched to fuel economy
LAND USE
Settlement patterns and vehicle choice play major roles in high per capita fuel consumption, and the rural landscape of the Windham Region has led to homes being built far from downtown and village centers, where services are accessed. The result of separated residential areas is that trips to markets, schools, and work tend to be only possible with the use of an automobile. In the Windham Region, rural residential sprawl has occurred where homes located along rural roads have been separated from all other aspects of daily life.
Another factor affecting fuel consumption is the location of major employers far from residential areas and the development of strip commercial areas designed and built at scales that encourage automobile access and discourage pedestrian and bicycle traffic. Increased road capacities that encourage more driving at faster speeds may also have helped contribute to the increased per capita transportation energy use. The Vermont Department of Public Service estimates that lowering the speed limit to 55 miles per hour on the Interstate highways would lead to a 3% reduction in State-wide fuel consumption. While such a reduction in speed limits may not be politically feasible, education of drivers regarding driving habits and the costs of faster speeds may encourage individuals to reduce their driving speeds voluntarily.
THERMAL
Estimates for thermal energy consumption are significantly influenced by building type and use case. As a result, the following section describes the methods and assumptions used to separately determine residential and commercial heating consumption in the Windham Region. Industrial building thermal demand is not included in the analysis due to a lack of available data. The 2023 Municipal Consumption Tool was used to derive heating consumption estimates for the Region and to organize key assumptions about the data.
RESIDENTIAL
The average annual heating load for residences in the Region was assumed to be the same as the state average of 110 MMBtu for both space and water heating. According to the 2023 American Community Survey, there are 32,975 housing units in the Region, 20,680 of which are year-round residences (designated as “occupied units” by the Census). 1,459 of these primary residences are heated by electrical heating systems. Efficiency Vermont’s data on regional electrical demand (see “Electricity” section above) accounts for electricity used to heat homes, so to avoid double-counting this category of consumption, these 1,459 residences are subtracted from the analysis, leaving 19,221 residences. The annual thermal energy used in primary homes is therefore, 2,114,310 MMBtu
Figure 11 illustrates this energy consumption by fuel type. The Region depends heavily on fuel oil and kerosene, with this fuel source supplying over 50% of the residential heating needs. As most of the fuel types are not locally produced (fossil fuel sourced), the funds going to this supply are funneled out of the state and Region.
For residential buildings, it was assumed that the average annual heating load of area residences is 110 million Btu, for both space and water heating, using the Vermont state average. In 2020, with 31,204 housing units in the Region, this arrives at an estimated 3,432,440 MMBtu annual total heat consumption. Figure 12 illustrates this energy consumption by fuel type. The Region depends heavily on fuel oil and kerosene, with this fuel source supplying over 50% of the residential heating needs. As most of the fuel types are not locally produced (fossil fuel sourced), the funds going to this supply are funneled out of the state and Region.
FIGURE 11 WINDHAM REGION RESIDENTIAL HEATING FUEL TYPES [12]
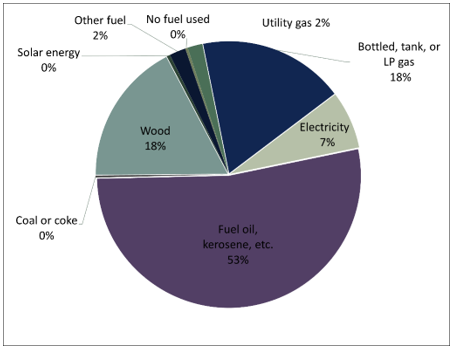
Wood provides 18% of the residential heating needs for the Region. The Windham Region has some of the most robust lumber resources in the state. A study completed by Innovative Natural Resources Solutions (INRS) revealed Windham County has the most volume of standing trees of any Vermont county at 1.6 billion cubic feet and grows over 20 million cubic feet per year (approximately 250,000 cords). The forests in Windham County are more productive than other Vermont counties because they are found at lower elevations characterized by richer soils[13]. With this abundant resource, the Region has the ability to support a significantly higher percentage of its heating needs with advanced wood heating options while supporting an important local economy.
Electricity is currently only 7% of the energy used to heat homes. However, with State incentives, desires to move to a cleaner heat source, and the additional cooling benefits of Electric Heat Pumps, many residences and commercial establishments are increasingly installing these systems as primary or secondary sources of heat. WRC expects to see the electric sector rise as a source of heating in the region.
In the Windham Region, there is also a high percentage of seasonal homes, at 37.2% of total housing units. Based on the energy model projections from the state, (see Vermont Pathways Output Discussion below,) it can be assumed that seasonal homes only use about 15% of the energy of a primary home, due to more occasional use and a presumed higher energy efficiency. However, seasonal homes in the Windham Region are often used for longer periods of time and for more energy-intensive applications, like winter lodging. To account for this dynamic, towns on the eastern half of the region are estimated to use 15% of the energy of year-round homes, while towns on the western half of the region (which are closer in proximity to the region’s winter recreation areas), are estimated to use 25% of the energy of primary residences. As such, seasonal homes in the Region are estimated to consume about 306,102 MMBtu of the Region’s total heat consumption.
COMMERCIAL
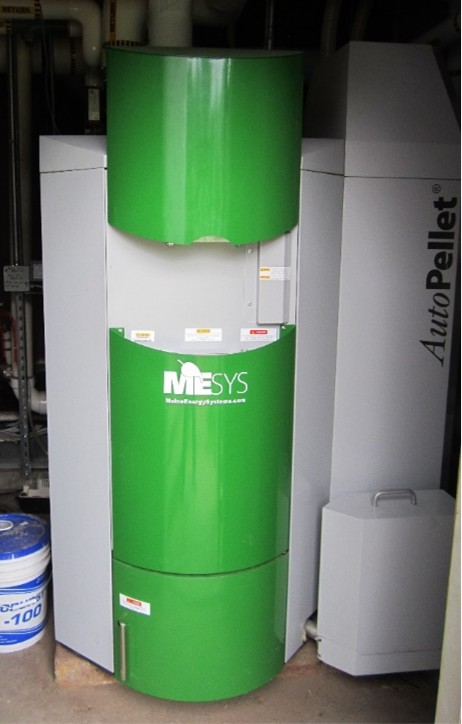
For commercial establishments, it is estimated that the average annual heating load in the Region is 1,080 MMBtu. For the state, the average is 700 MMBtu to 750 MMBtu, but the average for any given area will be significantly higher or lower, as the mix of businesses from region to region is highly variable. Based on the types of businesses in the Windham Region, the commercial heating load was determined to be higher than the state average.[14].With 1,713 commercial establishments in Windham County, there is an estimated thermal energy demand of 1,849,522 MMBtu per year. Like the residential sector, the largest percentage of fuel type used for commercial heating is fuel oil and kerosene. With the variable costs of oil from year to year, some businesses have been looking for alternative ways to heat their establishments. For example, in the Windham Region, 49% of public schools are operating Advanced Wood Heat systems, and 6% are operating under solar systems.[15]
Marlboro Elementary school
Photo Credit: WRC
WINDHAM WOOD HEAT PROGRAM
The Windham Regional Commission and several partners operated the Windham Wood Heat Program from 2015 – 2022. This program, with funding provided by the closure of Vermont Yankee Nuclear Plant, was operated under guidance from the State of Vermont Clean Energy Development Fund. WRC distributed funds through competitive grants to public entities and public facing organizations. Through this program, 9 AWH systems were installed in public schools, 2 in public facing institutions, and 2 in new public facing institutions. Through an independent evaluation, these installations had a verified CO2 Reduction of 1,009 tons. Annual verified fossil fuels saved were 102,210 gallons of fuel oil and 15 tons of coal[16]. Financial assistance was a large driver in commercial establishments converting to renewable heating options.
[1] Windham Regional Energy Plan, 2018.
[2] Data Source: U.S. Census (2010, 2020) Vermont Indicators, http://www.vcgi.org/indicators (1790 - 2000).
[3] US Energy Information Administration: State Energy Data System 1960-2022. https://www.eia.gov/state/seds/seds-data-complete.php?sid=VT#Consumption.
[4] Estimates for thermal and transportation sector energy use were calculated using the Vermont Public Service Department’s (PSD’s) Municipal Consumption Tool, with input from several key data sources, including the 2023 American Community Survey, the Vermont Department of Labor’s Economic and Labor Market Information, the Vermont Department of Motor Vehicles, Drive Electric, and the US Energy Information Administration. Electrical energy use is reported directly to the Windham Regional Commission by Efficiency Vermont. Refer to Appendix B of the Energy Chapter for a full description of the methods used to calculate regional energy consumption.
[5] Data compiled from WRC Efficiency Vermont Data Reports between 2022-2024
[6] Information on existing generation in the Region comes from ISO New England, which conducts a triannual survey of all distribution utilities in New England.
[7] Where Does Vermont’s Electricity Come From? Presentation by the Public Service Department on January 31 and February 2, 2023. https://publicservice.vermont.gov/sites/dps/files/documents/Webinar%201%20-%20Where%20does%20VT%20electricity%20come%20from.pdf
[8] See 3 one-page resources for more info: Where does Vermont’s electricity come from?, Current policies & programs, and Tradeoffs between different sources of electricity- these documents were made available as part of the Say WATT? Regional Event Series in the fall of 2023 during which the Department of Public Service partnered with the RPCs to offer a series of engagement opportunities for Vermonters to weigh in on renewable electricity policies and programs.
[9] Data USA: Windham County, VT https://datausa.io/profile/geo/windham-county-vt
[10] Vermont Transportation Energy Profile, 2021. https://vtrans.vermont.gov/sites/aot/files/planning/documents/planning/2021%20Vermont%20Transportation%20Energy%20Profile.pdf
[11] Drive Electric: Vermont EV Registrations by Municipality as of Jan 2024, 2024. https://veic.maps.arcgis.com/apps/mapviewer/index.html?webmap=7a62de8f69954804889c86a12a9640c8
[12] Data Source: U.S. Census, American Community Survey, 2023.
[13] INRS, An Initial Wood Supply Analysis for the Windham Wood Heat Initiative, 2015
[14] Average commercial heating load value was determined using the Municipal Consumption Tool. Possible explanations for the higher than average commercial heating load could include an older (and less efficient) compared building stock in our Region and the specific mix of industries. The “Healthcare and Social Services” and “Manufacturing” sectors are prominent in the Windham Region, and these industry types typically use considerable heat energy.
[15] Windham Wood Heat program analysis completed by the Windham Regional Commission.
[16] Evaluation of the Windham Wood Heat Program, prepared for Windham Regional Commission by West Hill Energy and Computing. 2023