Regional Profile
Regional Data
The following section provides a summary of population and demographic data for the region. Data on housing characteristics can be found in the Housing Chapter and data on economic characteristics can be found in the Economic Development Chapter. Where appropriate, an analysis of the data and trends has been included to provide a more detailed story behind these numbers.
The information was gathered from the 2020 Census, recent American Community Surveys, and other resources. All data sources are referenced. The most extensive and reliable source for a large portion of the data relevant to the planning process is the U.S. Census Bureau. Complete surveys are completed on a ten-year cycle and collect “point-in-time” data. The Regional Plan is updated on an eight-year cycle.
The American Community Survey (ACS) provides five-year estimates. Generally, when the ACS was used in this planning process, WRC used the five-year estimates for the years 2016 – 2020 or 2017-2021. As a result, ACS data can only provide a general estimate of the existing conditions and has a relatively large margin of error for smaller geographies, such as the town level. This should be kept in mind when analyzing data and making direct comparisons between ACS data and Census data. Despite the limitations, the ACS data still provides useful information for the planning process.
Population
The population of the 27 towns that make of the Windham Region totals 48,538, as reported in the 2020 Census. Between 2010 and 2020, the population of the region grew by 1,818, or approximately 3.9 percent. This compares with a population growth of approximately 2.8 percent for Vermont as a whole. The population percentage increase between 2010 and 2020 was noticeably higher than the previous decade (2000 to 2010) when the population grew by only 0.6 percent.
Figure 1-1: Windham Region Population (1790 – 2020)
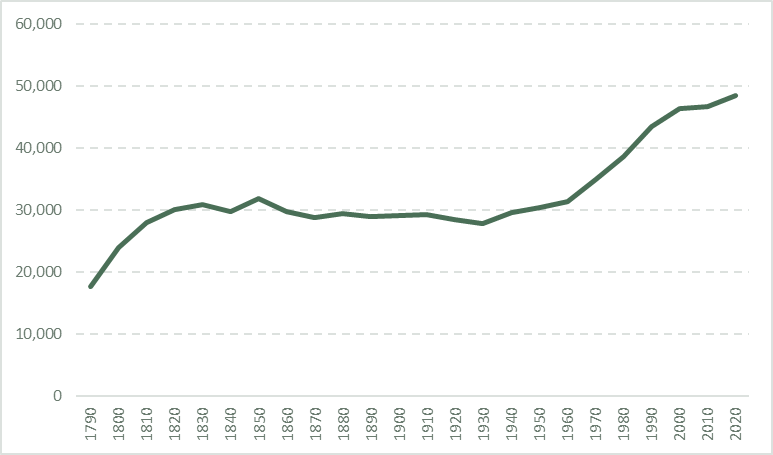
Data Source: U.S. Census (2010, 2020) Vermont Indicators (http://www.vcgi.org/indicators (1790 - 2000)
It should be noted there may be an issue with the population count for the town of Marlboro, which would artificially inflate the region’s population for 2020. According to the Census data, Marlboro’s population increased by 644 between 2010 and 2020, from 1,078 to 1,722, a growth rate of 60 percent. The ACS 2020 5-year estimates show that Marlboro saw a net decrease in housing units by one during this same time. This discrepancy may have to do with the counting of the student population on the former Marlboro College campus, which closed at the end of 2019-2020 academic year. The additional 644 residents in Marlboro, as reported by the 2020 Census, accounts for roughly one-third of the population growth in the region during the past decade and if it were to be subtracted out, the population growth for the region would be closer to 2.5 percent versus 3.9 percent.
|
The Windham Region has experienced uninterrupted population growth since 1950. The greatest population growth during a ten-year period occurred from 1980 to 1990, with a 12.5 percent increase in population. The statewide population growth for that same period was 10 percent. From 1950 to 2000, the average ten-year population growth was 7.9 percent. Since 2000, the rate of growth in the region has slowed substantially. Time will tell whether the uptick in the rate of population growth between 2010 to 2020 will continue, although there are several factors that may lead to continued growth in the region. The region saw an influx of residents as a result of the COVID-19 Pandemic beginning in early 2020. The in-flow of residents has included second homeowners in the region making the area their permanent residence, and newcomers to the region, many from urban areas seeking a different type of lifestyle. |
Figure 1-2: Windham Region Population (1950 – 2020)
Data Source: U.S. Census (2010, 2020) Vermont Indicators (http://www.vcgi.org/indicators (1790 - 2000) |
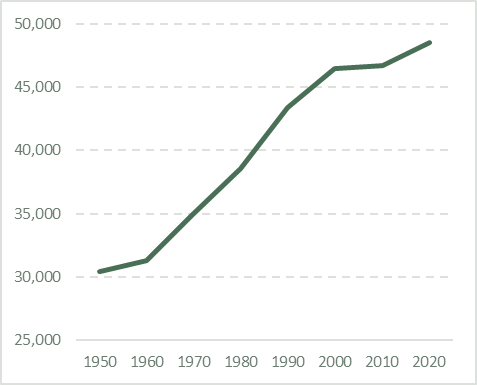
Southeastern Vermont has also been welcoming new Americans through the Community Asylum Seekers Project and the Ethiopian Community Development Corporation. Finally, WRC anticipates more individuals resettling in the region due to the impacts of climate change making other areas of the country less hospitable. These factors are expected to bring new residents into the region over the upcoming years, but it is unlikely we would experience the same rate of growth as between 1960 to 2000.
The table below shows the town population changes that have occurred from 1990 to 2020. Towns that experienced the highest average percentage change (20 percent or greater) are highlighted in purple. Town that experienced less growth or population decline are highlighted in blue. Communities that experienced the most growth include Dover, Marlboro, Stratton, Windham, and Winhall.
Table 1-1: Windham Region Town Populations (1990 – 2020)
| Town | 1990 | 2000 | 2010 | 2020 | Avg Pct Change 1990-2020 |
Pct Change 2010-2020 |
|---|---|---|---|---|---|---|
| ATHENS | 313 | 340 | 442 | 380 | 8.2% | -14% |
| BRATTLEBORO | 12,241 | 12,005 | 12,046 | 12,184 | -0.1% | 1% |
| BROOKLINE | 403 | 467 | 530 | 540 | 10.4% | 2% |
| DOVER | 994 | 1,410 | 1,124 | 1,798 | 27.1% | 60% |
| DUMMERSTON | 1,863 | 1,915 | 1,864 | 1,865 | 0.0% | 0% |
| GRAFTON | 602 | 649 | 679 | 645 | 2.4% | -5% |
| GUILFORD | 1,941 | 2,046 | 2,121 | 2,120 | 3.0% | 0% |
| HALIFAX | 588 | 782 | 728 | 771 | 10.6% | 6% |
| JAMAICA | 754 | 946 | 1,035 | 1,005 | 10.6% | -3% |
| LONDONDERRY | 1,506 | 1,709 | 1,769 | 1,919 | 8.4% | 8% |
| MARLBORO | 924 | 978 | 1,078 | 1,722 | 25.2% | 60% |
| NEWFANE | 1,555 | 1,680 | 1,726 | 1,645 | 2.0% | -5% |
| PUTNEY | 2,352 | 2,634 | 2,702 | 2,617 | 3.8% | -3% |
| READSBORO | 762 | 805 | 763 | 702 | -2.5% | -8% |
| ROCKINGHAM | 5,484 | 5,309 | 5,282 | 4,832 | -4.0% | -9% |
| SEARSBURG | 85 | 96 | 109 | 126 | 14.0% | 16% |
| SOMERSET | 2 | 5 | 3 | 6 | 70.0% | 200% |
| STRATTON | 121 | 136 | 216 | 440 | 58.3% | 104% |
| TOWNSHEND | 1,019 | 1,149 | 1,232 | 1,291 | 8.2% | 5% |
| VERNON | 1,850 | 2,141 | 2,206 | 2,192 | 6.0% | -1% |
| WARDSBORO | 654 | 854 | 900 | 869 | 10.8% | -3% |
| WESTMINSTER | 3,026 | 3,210 | 3,178 | 3,016 | 0.0% | -5% |
| WESTON | 488 | 630 | 566 | 623 | 9.6% | 10% |
| WHITINGHAM | 1,177 | 1,298 | 1,357 | 1,344 | 4.6% | -1% |
| WILMINGTON | 1,968 | 2,225 | 1,876 | 2,255 | 5.8% | 20% |
| WINDHAM | 251 | 328 | 419 | 449 | 21.8% | 7% |
| WINHALL | 482 | 702 | 769 | 1,182 | 36.3% | 54% |
Data Source: U.S. Census (2010, 2020) Vermont Indicators (http://www.vcgi.org/indicators) (1990, 2000)
The towns of Dover, Stratton, Windham, and Winhall are located in the western area of the region and generally either have a ski resort in the community or are in close proximity to a ski area. It should also be noted that the town of Winhall is located adjacent to the town of Manchester, outside of the Windham Region, and its proximity to this commercial and job center could be one reason it has seen population growth. All four of these communities have a high number of second homes as a percentage of their total housing stock: Dover (82%), Stratton (94%), Windham (62%), and Winhall (81%). The population increase in these communities may partially be a result of second homes owners making these their permanent residences.
Most of the communities that experienced slower average growth (less than 3 percent) or population decline during this period are located in or just outside of the Connecticut River Valley: Guilford, Brattleboro, Dummerston, Westminster, Rockingham, and Newfane. The other two towns with slow growth or population decline were Grafton and Readsboro. The towns of Guilford, Dummerston, Putney, Westminster, and Newfane saw significant population growth in the period between 1960 to 2000. This growth began to level off beginning in 2000 and has remained relatively stable since then or decline. The two historically industrial and population centers for the region, Brattleboro and Rockingham, saw their residential populations generally plateau earlier – approximately by 1970 for Brattleboro and by 1960 for Rockingham.
As noted earlier, there is a discrepancy in the population count for the town of Marlboro in the 2020 Census that may be skewing the data for that community. Somerset is unincorporated and its population has been less than 10 people since 1950. Large percent population changes can result from the increase or decrease of only several individuals in Somerset.
The table below shows the population changes that have occurred in the region’s incorporated villages and census designated places (CDP) from 1990 to 2020. CDPs are locally recognized communities with a population concentration, but lack legal status. Many of the CDPs in the region were recently added for the 2020 census and historical data is not available for these settlements. Additionally, as noted in the table below, the boundaries for some CDPs have changed between Census counts which accounts for some of the population increase or decrease seen in these areas. Despite efforts to encourage development within the region’s village centers and downtowns, all of the villages and CDPs with data going back to 1990 have seen a population decrease over this 30-year period. As of 2020, the total population within village and CDPs was 17,390, approximately 36% of the region’s total. This trend has implications for land use and development strategies for the communities in which these villages and CDPs are located.
Table 1-2: Villages and Census designated places Populations (1990 – 2020)
Table 1-2: Villages and Census Designated Places Populations (1990 – 2020)
| Village/Census Designated Place (CDP) | 1990 | 2000 | 2010* | 2020* | Avg Pct Change 1990-2020 | Pct Change 2010-2020 | ||
|---|---|---|---|---|---|---|---|---|
|
Algiers CDP |
- |
- |
- |
186 |
- |
- |
||
|
Bellows Falls village |
3,313 |
3,165 |
3,148 |
2,747 |
-6% |
-13% |
||
|
Bellows Falls village |
3,313 |
3,165 |
3,148 |
2,747 |
-6% |
-13% |
||
|
Brattleboro CDP* |
8,612 |
8,289 |
7,414 |
7,352 |
-5% |
-1% |
||
|
Chimney Hill CDP |
- |
- |
- |
263 |
- |
- |
||
|
Grafton CDP |
- |
- |
- |
49 |
- |
- |
||
|
Harmonyville CDP |
- |
- |
- |
92 |
- |
- |
||
|
Jacksonville village |
244 |
237 |
223 |
213 |
-4% |
-4% |
||
|
Jamaica CDP |
- |
- |
- |
174 |
- |
- |
||
|
Londonderry CDP |
- |
- |
- |
180 |
- |
- |
||
|
Newfane village |
164 |
116 |
118 |
- |
-14% |
- |
||
|
North Westminster village/CDP* |
268 |
271 |
247 |
262 |
-1% |
6% |
||
|
Putney CDP |
- |
- |
523 |
571 |
- |
9% |
||
|
Readsboro CDP |
- |
- |
321 |
297 |
- |
-7% |
||
|
Saxtons River village |
541 |
519 |
565 |
479 |
-3% |
-15% |
||
|
South Londonderry CDP |
- |
- |
- |
147 |
- |
- |
||
|
Stratton Mountain CDP |
- |
- |
- |
335 |
- |
- |
||
|
Townshend CDP |
- |
- |
- |
199 |
- |
- |
||
|
Wardsboro CDP |
- |
- |
- |
70 |
- |
- |
||
|
West Brattleboro CDP* |
3,135 |
3,222 |
2,740 |
2,803 |
-3% |
2% |
||
|
West Dummerston CDP |
- |
- |
- |
77 |
- |
- |
||
|
Westminster village |
399 |
276 |
291 |
287 |
-9% |
-1% |
||
|
Weston CDP |
- |
- |
- |
77 |
- |
- |
||
|
Whitingham CDP |
- |
- |
- |
91 |
- |
- |
||
|
Wilmington CDP* |
- |
- |
463 |
439 |
- |
-5% |
||
|
*Some CDP boundaries changed in the 2010 and 2020 Census, which accounts for some of the population increase or loss seen in these areas. For example, the Brattleboro CDP and West Brattleboro CDP boundaries were reduced significantly for the 2010 Census and this contributed to the apparent decrease in population in these areas. The North Westminster village/CDP enlarged in the 2020 Census to include approximately 18 additional housing units. The Wilmington CDP enlarged in 2020 as well, but there was still a population decrease. |
||||||||
Data Source: U.S. Census (2010, 2020) Vermont Indicators (http://www.vcgi.org/indicators) (1990, 2000)
The table below shows how town populations as a percentage of the region’s total population has changed from 1950 to 2020. Most significant is the substantial decrease in Brattleboro and Rockingham’s population as a percentage of the region’s total. In 1950, the combined population of Brattleboro and Rockingham accounted for approximately 56 percent of the region’s population. By 2020, this has declined to 35 percent. At the same time, all of the other communities in the region saw an increase in their populations as a percentage of the region’s total, except Readsboro, indicating a dispersal of the population’s concentration during this period. The communities that saw the biggest increase in their percentage of the region’s population were Dover, Guilford, Marlboro, Putney, Vernon, Westminster, and Winhall.
figure 1-4: Town population as percentage of windham region population
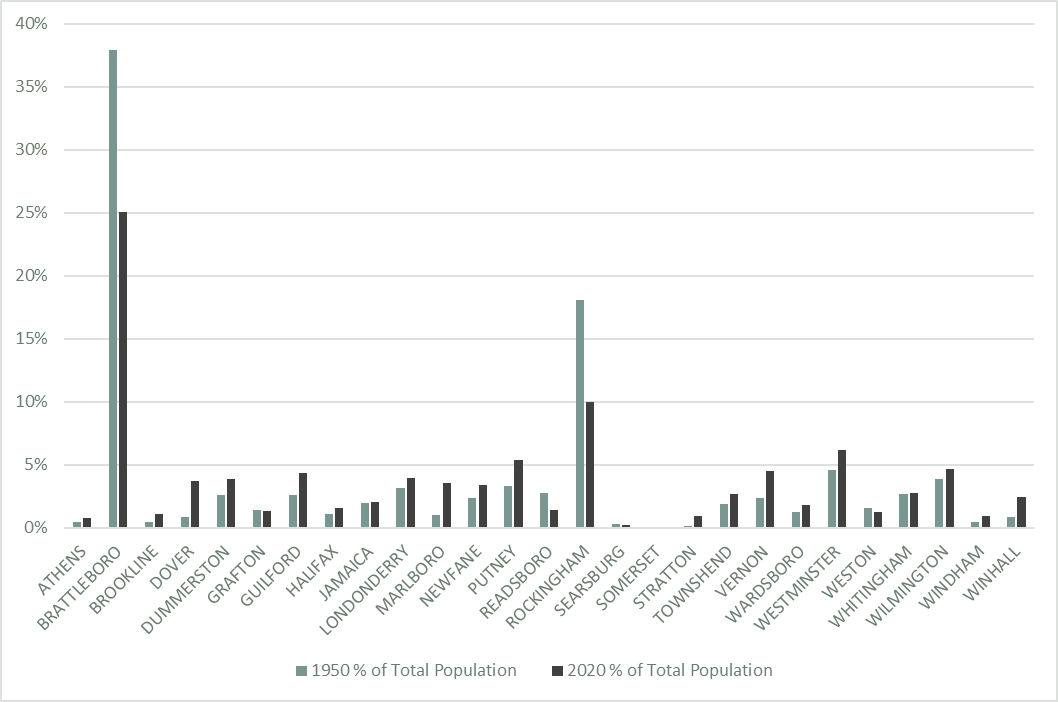
Data Source: U.S. Census (2020) Vermont Indicators (http://www.vcgi.org/indicators (1950)
RACE AND ETHNICITY
Between 2010 and 2020, the population’s racial composition became more diverse. The percent of the population identifying as white decreased from 94.3 to 89.6 percent. The group that saw the largest increase during this period was individuals identifying as being two or more races. This group grew from 1.7 percent of the population in 2010 to 4.8 percent in 2020. The other categories, including Black or African-American, American Indian or Alaska Native, Asian, Native Hawaiian and other Pacific Islander, and Some other Races, remained generally consistent with the 2010 ratios. The percent of individuals of Hispanic or Latino origin increased from 1.8% to 2.8% of the region’s population between 2010 and 2020.
The increase in racial and ethnic diversity between 2010 and 2020 was generally seen in every community in the region and not confined to certain areas. That being said, the communities with the most diversity continue to be the larger towns along the I-91 corridor, including Brattleboro, Rockingham, Westminster, and Putney. This trend of the region becoming more racially and ethnically diverse is expected to continue, especially in light of the region’s support of resettlement efforts, such as the Community Asylum Seekers Project, and an anticipated increase in those relocating due to the impacts of climate change.
AGE
Figure 1-5 below shows the region’s population by age in 2010 as compared to 2020. Between 2010 and 2020 the Windham Region grew older, a trend that is playing out across Vermont. The population aged 65 or older grew by 3,913 and in 2020 accounted for 24% of the region’s population compared to only 16% in 2010. At the same time, the population aged 19 or younger declined by 925 and decreased from 22% to 20% of the region’s population. The aging of the population has numerous implications for how the region supports these residents in terms of housing and services. There is also a pressing need to recruit new workers to the region as older resident begin to retire in more significant numbers.
figure 1-5: windham region population By age, 2010 - 2020
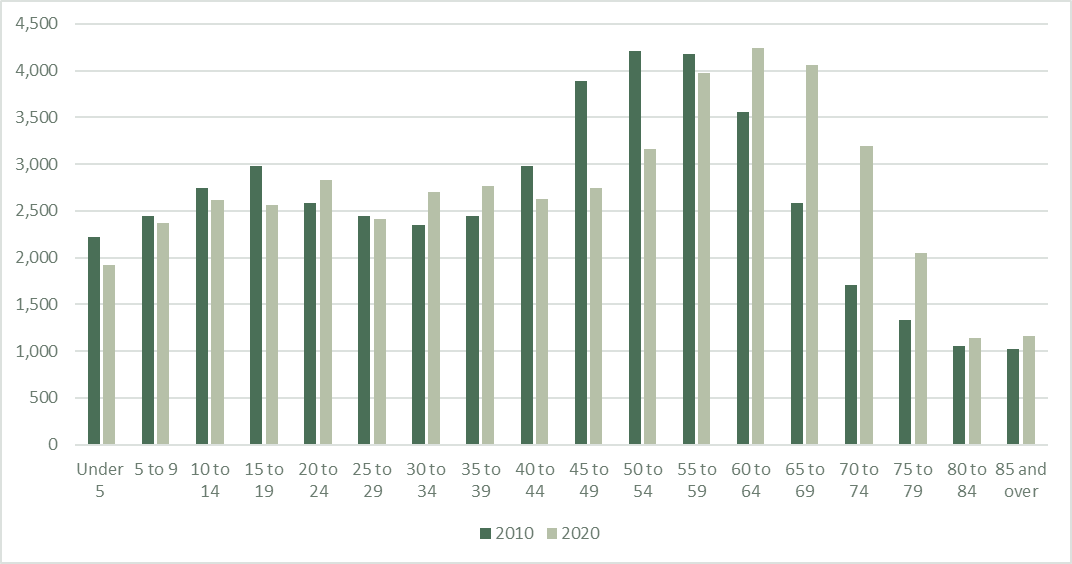
Data Source: U.S. Census, 2010 and 2020