Energy
Targets
VERMONT PATHWAYS OUTPUT DISCUSSION
As part of the development of Vermont’s 2022 Comprehensive Energy Plan (CEP) and 2021 Climate Action Plan (CAP), Stockholm Environment Institute (SEI) and Northeast States for Coordinated Air Use Management (NESCAUM) developed a scenario model of Vermont’s energy consumption and emissions and used the model to construct pathways to meet statutory greenhouse gas (GHG) reduction obligations under the state’s Global Warming Solutions Act (GWSA). This model is known as the Vermont Pathways model, and was built using SEI’s Low Emissions Analysis Platform (LEAP), a software tool for energy system modeling and emissions accounting. The Vermont Pathways model contains an analysis and projection of residential, commercial, industrial, and transportation energy demand at the statewide level.
To support enhanced energy planning for regions and municipalities, PSD regionalized the final energy demand outputs from the statewide Vermont Pathways model for four core sectors: residential, commercial, industrial, and transportation. A simple disaggregation of those results was conducted for each of the regional planning commissions based on key drivers of energy demand. The model was developed with two scenarios for Vermont’s future in mind:
- The Baseline or “business-as-usual” scenario, developed to estimate Vermont/the Region’s energy demand under normal policy and programmatic conditions;
- The Central GWSA Mitigation or “CAP Mitigation” scenario, developed to meet the state’s GHG reduction requirements.
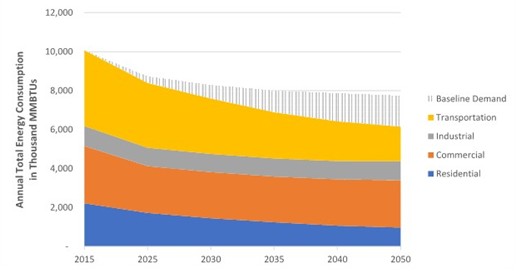
On state and regional levels, energy demand is depicted as decreasing substantially by the year 2050. Figure 12 below illustrates the total Windham Region demand by sector. The Baseline Scenario is the upper curve of the barred area. This barred area illustrates the difference between the energy demand of the Baseline Scenario verses the CAP Mitigation Scenario. Much of this difference is accounted for through assumed conservation and efficiency measures across all energy sectors (transportation, heating, electricity) due to gains in technological efficiency and decreased demand due to conservation measures.
FIGURE 12: WINDHAM REGION ENERGY CONSUMPTION BY SECTOR, CAP MITIGATION SCENARIO
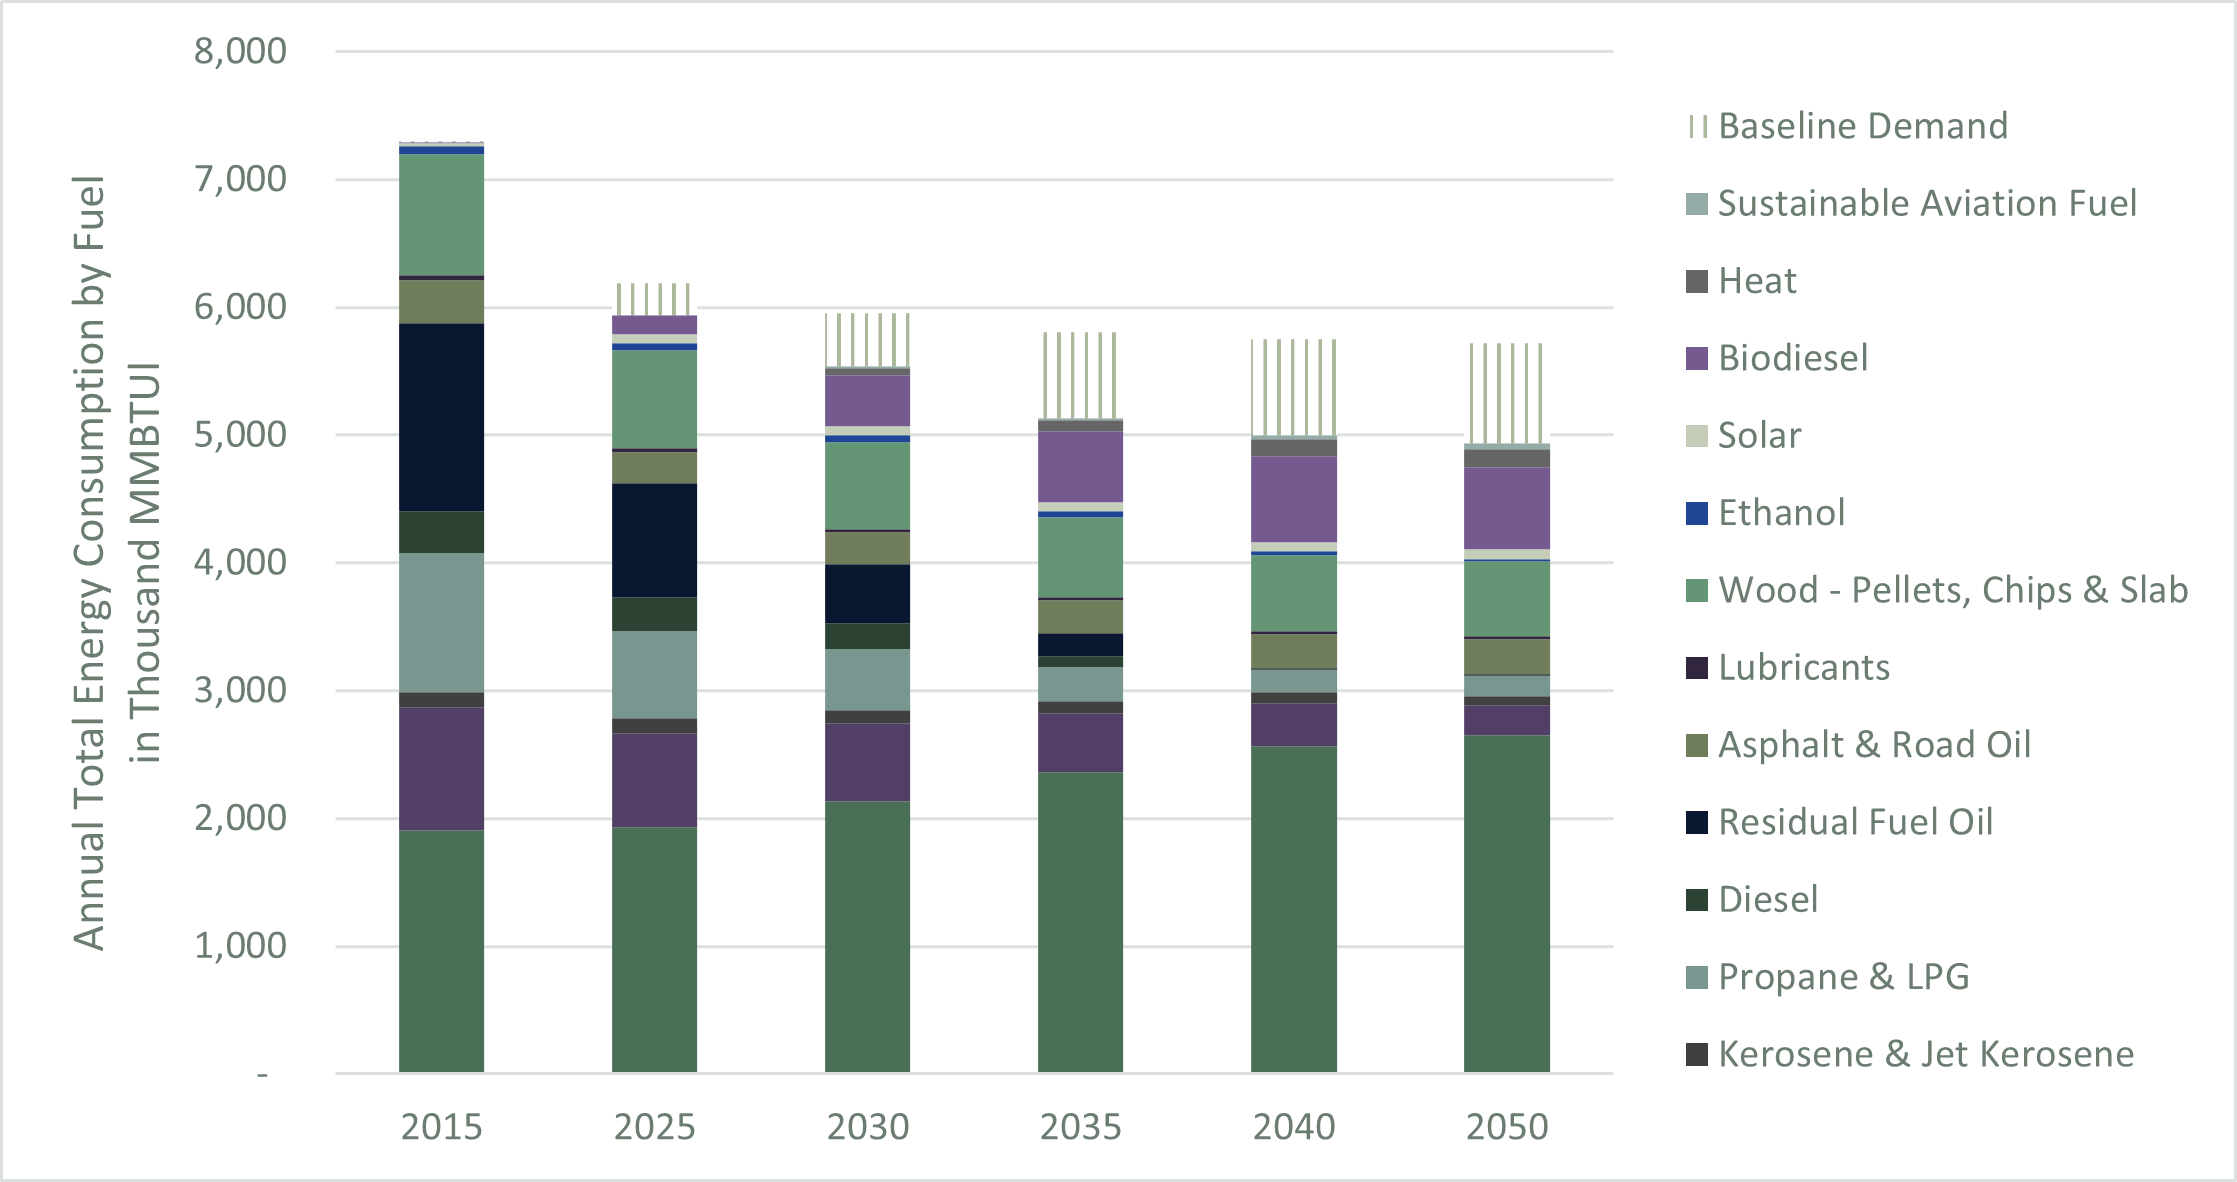
The Windham Region’s energy consumption by fuel type over time is depicted in Figure 13. Throughout the benchmark years, the model assumes fossil fuel consumption is phased out and replaced by more renewable resources. The total volume of fuel decreases due to assumptions about advancements in efficiencies across all sectors.
FIGURE 13: WINDHAM REGION ENERGY CONSUMPTION BY FUEL, CAP MITIGATION SCENARIO
Electricity
The electric sector is where much of the change will occur over time. The model assumes electrification of the light duty vehicle fleet and electrification of heating and cooling systems, resulting in a dramatic increase in electricity consumption. However, the model also assumes increased efficiency of these technologies over time. The increase in consumption is offset by the increases in efficiency and leads to what looks like gradual increases in the electricity consumed. In the year 2050, electricity is the primary source of fuel for the region and accounts for almost half of the total fuel consumed.
TRANSPORTATION
Transportation currently accounts for 29% of the Windham Region’s energy consumption. To achieve the 90x50 goal, the transportation sector will need to radically transform its fleet efficiency and fuel sources. The model assumes consumption of fuels in the transportation sector will drop by 46% from the 2015 base estimates, and that the makeup of the energy mix will change from predominantly gasoline to electricity.
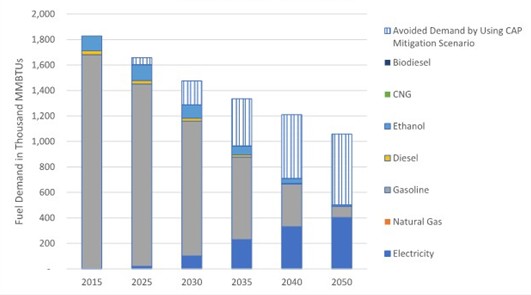
The Vermont Pathways model breaks down the transportation sector into passenger cars, light trucks, medium duty vehicles, heavy duty vehicles, and non-road vehicles. The model applies separate fuel switching assumptions for each of these transportation categories. The notable decreases in consumption are in the passenger car, light truck, and medium duty categories. Figure 14 and 15 show the changes over time for passenger cars and light trucks, respectively.
FIGURE 14: REGIONAL PASSENGER CAR ENERGY DEMAND, CAP MITGATION SCENARIO
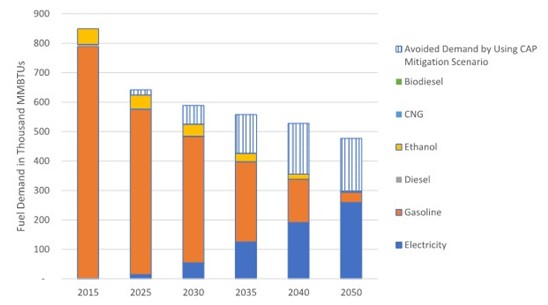
FIGURE 15: REGIONAL LIGHT TRUCK ENERGY DEMAND, CAP MITIGATION SCENARIO
THERMAL
RESIDENTIAL
Today, the heating sector consumes approximately 52% of the energy in the region. The Vermont Pathways model shows a substantial decrease in home heating consumption between 2015 and 2050. In Figure 16 below, the Baseline Scenario is accounted for on the upper limit of the lined bar. Both the Baseline and CAP Mitigation Scenario project a decrease in residential heating consumption over the next several decades. The decrease in consumption is a result of underlying assumptions in the Vermont Pathways model. The model indicates that even in the Baseline Scenario, a larger share of households in the state will adopt heat pump systems, leading to decreased energy use in the thermal sector. The model also accounts for technological advances in the efficiency of heat pumps and the efficiency that residential weatherization progress (with no programmatic or policy shifts) will bring about. Collectively, these modeling assumptions account for the decreases in energy use in the Baseline Scenario portion of the graph in Figure 16.
FIGURE 16: REGIONAL RESIDENTIAL SECTOR ENERGY DEMAND
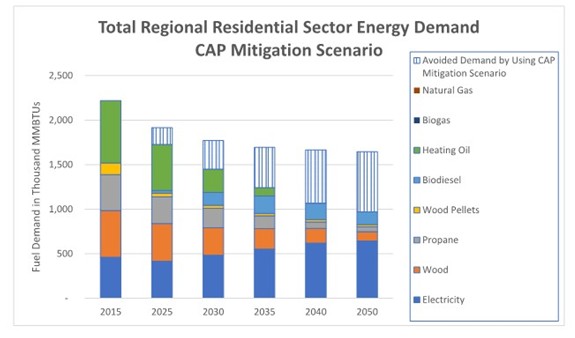
The underlying assumptions in the CAP Mitigation Scenario are similar to those in the Baseline Scenario. In Figure 16, a notable trend is that most of the fuels decrease in volume by 2050. This is where efficiency plays a substantial role in statewide progress on energy. Although the volume of these sources is decreasing, that decrease assumes weatherization and building envelope conservation measures. Therefore, a decreasing volume of fuel is assumed to be capable of heating more space, overall. The two fuel types that show increasing volume are electricity and biodiesel. Second homes account for approximately 35% of the Windham Region’s housing stock. The LEAP model assumes that second homes use 15% of the heating fuel of year-round homes.
COMMERCIAL AND INDUSTRIAL
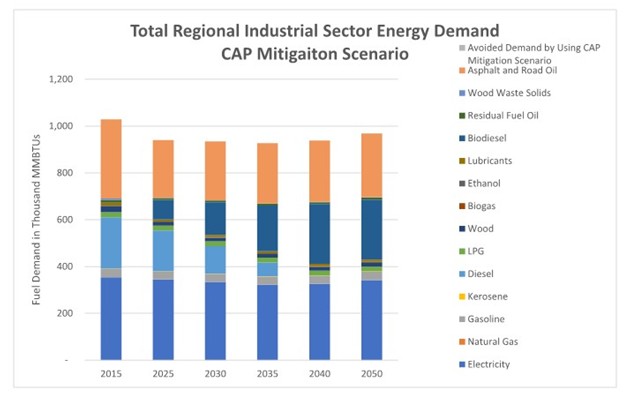
The Vermont Pathways model assumes that the least amount of change in energy consumption and fuel mix will be in the commercial and industrial sectors. This is due to an assumed growth in these sectors over time. Figure 17 illustrates industrial consumption in the region. In total energy units, there is very little difference between the Baseline and CAP Mitigation Scenarios. There are, however, two noticeable trend assumptions underlying the fuel mix ratio: that electricity consumption decreases substantially over time, and that wood is increasingly used as a fuel source. Residual fuel oil and liquid petroleum gas (LPG) both remain more or less constant over time as they are denser fuels with no efficient substitute as of yet. These results are directly from the Total Energy Study.[1]
FIGURE 17: REGIONAL INDUSTRIAL SECTION ENERGY DEMAND
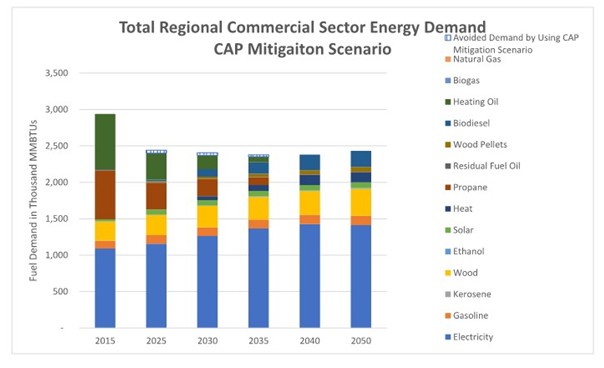
Commercial Energy Demand portrayed in Figure 18 also varies little between the Reference and 90x50 CAP Scenarios. However, the 90x50 scenario assumes that heating oil and propane are replaced by an increase in electricity, biodiesel and biogas, and that overall energy consumption decreases by 17%. The commercial sector is assumed to grow over time, accounting for only moderate decline in total energy consumption.
FIGURE 18: REGIONAL COMMERCIAL SECTOR ENERGY DEMAND
TARGETS AND CURRENT STATUS COMPARISONS
The projections from the Vermont Pathways model indicate how much change is needed in Vermont’s energy and emissions profile to achieve the greenhouse gas emissions reduction requirements of the GWSA. Though the actual pathway is likely to divert from what is presented, the model allows the Windham Region to plan for the future by establishing targets for energy efficiency, conservation, and fuel-switching across the various sectors.
The following sections present these energy targets and discuss their implications for the Region. Targets for thermal efficiency, conservation, and fuel-switching for heating and transportation were derived from the Vermont Pathways model and its regionalized outputs. Some adjustments were made to the outputs of the Vermont Pathways model following guidance from the Public Service Department. The 2022 EEU Market Potential Study was used to produce targets for electrical efficiency and conservation. For a full description of the methods used to derive these targets, refer to Appendix B of the Energy Chapter.
Targets were developed for the years 2025, 2035, and 2050. It is important to note that the Vermont Pathways model does not perfectly capture the realities of the Region’s energy profile and that targets are intended to be aspirational by nature–they are not requirements. Unless otherwise noted, regional energy targets embody the rate of progress needed to meet the CAP Mitigation Scenario objectives. Wherever possible, the following sections compare current data to the projected rate of progress embedded in the Vermont Pathways model. For full Windham Region Vermont Pathways results, please refer to Appendix A of the Energy Chapter.
In addition to developing regional energy targets, WRC broke this analysis out to each of the Region’s 27 municipalities. These expanded and disaggregated municipal-level targets are available in Appendix C of the Energy Chapter.
THERMAL SECTOR: CONSERVATION AND EFFICIENCY TARGETS
The most approachable strategy that residents and businesses can take to help the Region meet its 90x50 targets is pursue thermal efficiency and conservation upgrades to residential and commercial structures. Outputs from the Vermont Pathways model indicate that the Windham Region must rapidly increase the number of weatherizations in the thermal sector to work toward this end.[2]
About a third of the Region’s housing stock was built before 1940. The relative age of the housing stock means that many homes fail to meet a high standard of thermal efficiency. Even homes in the Region built after 1940 often lack insulation in certain areas of the building envelope, or the existing insulation is inadequate for the space. Weatherizing the Region’s residential and commercial building stock is vital to increase the efficiency of building envelopes so they can retain indoor temperatures instead of leak warm (or cool) air through roofs, doors, windows, and walls.
TABLE 4: REGIONAL RESIDENTIAL WEATHERIZATION TARGETS AND CURRENT STATUS
Table 4 highlights how the Windham Region needs to greatly increase the number of household weatherizations. Efficiency Vermont (EVT) tracks data (see above) on residential building efficiency projects, however, it only tracks efficiency measures installed through the “Home Performance with ENERGY STAR” program. EVT’s data does not capture residential projects where weatherization work is being completed as part of a home renovation where the owner might not utilize program incentives, or for smaller weatherization projects that homeowners might accomplish, such as having window inserts installed through the Window Dressers program. One way to increase the number of residential weatherization projects is to work with regional organizations such as SEVCA and Window Dressers to provide information and education on programs and incentives available to homeowners. Other related actions include working with municipal energy committees to implement municipal weatherization programs that benefit homeowners and allow municipalities to document their progress and share it on a broader regional scale.
THERMAL SECTOR: FUEL SWITCHING TARGETS
The heating sector is the largest source of regional energy consumption (see “Windham Region Current Use and the cost of Energy” section). For the 90x50 goal to be attainable, thermal sector fuel conversion must be actively pursued to accompany efficiency and conservation improvements, reduce greenhouse gas emissions, enhance resilience, and achieve long-term cost savings.
The data in Table 5 illustrate the extent to which the fuel sources in the residential sector are anticipated to shift in the Vermont Pathway model’s CAP Mitigation scenario. Many of the targets from the model reflect the state’s priorities for thermal sector fuel conversion and renewable heat. For example, the Vermont Pathways model indicates that a rapid increase in the number of cold climate heat pumps is necessary to achieve state energy and climate goals. These targets embody policy objectives articulated by the 2022 CEP and the 2021 CAP, which emphasize rapid electrification of thermal sector energy sources. As a result, electrical heating energy is projected to increase significantly in the Vermont Pathways model. One area of the CAP Mitigation scenario in the Vermont Pathways model that may not accurately reflect the dynamics of the Windham Region is wood heat. According to the Census, 17.5% of homes in the area use wood for home heating, making it the third most widely used fuel source in the Region, and most common renewable heating option. Windham County has the largest volume of hardwoods and softwoods of any county in the state, and residents of Southern Vermont have a long history of harnessing these resources for fuel and warmth. As a result, wood heat has a distinct cultural significance for our Region. For these reasons, wood heat energy is not anticipated to decrease as the Vermont Pathways model suggests–if anything, it will likely increase over time. Other notable trends from the Vermont Pathways model are a complete abandonment of oil for heating by 2050, and the incorporation of biofuel blended alternatives to supplement this decrease. Propane heating energy is also modeled to decrease over time.
TABLE 5: REGIONAL RESIDENTIAL FUEL SWITCHING TARGETS
|
Fuel Type |
2025 Targets |
2035 Targets |
2050 Targets |
|
Electricity (Thousand MMBtu) |
152 |
281 |
365 |
|
Wood/Wood Pellets (Thousand MMBtu) |
463 |
260 |
129 |
|
Propane (Thousand MMBtu) |
217 |
106 |
39 |
|
Heating Oil (Thousand MMBtu) |
478 |
81 |
0 |
|
Biodiesel (Thousand MMBtu) |
29 |
164 |
102 |
|
Percentage of Renewables in the Heating Sector |
48% |
79% |
94% |
For the Region to meet its 90x50 objectives, a substantial number of cold climate heat pumps (CCPs) need to be installed in area homes and businesses. Towns have already made notable progress toward the 2050 residential heat pump goal, however. According to Efficiency Vermont, there have been 2,614 residential CCHP installations as of 2023. While there is still a significant amount of progress to be made here, the trajectory is hopeful. Heat pump water heater instillation targets indicate a need for 18,583 units by 2050, with current Efficiency Vermont estimates showing 650 in our Region as of 2023.
For commercial buildings, the Vermont Pathway model’s projected rate of heat pump adoption is even steeper. By 2050, there should be 31,144 commercial CCHP installs in the Region according to the CAP Mitigation Scenario. It is difficult to estimate how many area businesses will be electrified based on this information, since commercial buildings vary wildly, and the number of heat pumps required for each commercial space will be different from building to building. However, with 293 commercial CCHP installs as of 2023, there will need to be a sharp uptick in the number of electrified businesses regardless.
TABLE 6: REGIONAL COLD CLIMATE HEAT PUMP AND WATER HEATER INSTALLATION TARGETS FOR RESIDENTIAL AND COMMERCIAL ESTABLISHMENTS
|
|
CCHP Installations (EVT, 2023) |
2025 Targets |
2035 Targets |
2050 Targets |
|
Residential Cold Climate Heat Pumps |
2,614 |
6,187 |
16,635 |
24,515 |
|
Residential Heat Pump Water Heaters |
650 |
4,067 |
13,544 |
18,583 |
|
Commercial Cold Climate Heat Pumps |
293 |
8,052 |
24,352 |
31,144 |
TRANSPORTATION SECTOR: FUEL SWITCHING TARGETS
The Vermont Pathways model indicates that the Region’s light duty vehicle fleet (LDV) will need to transform radically by 2050. By 2050, the Region’s LDV traffic is targeted to be fueled predominantly by electricity, while gasoline-powered transportation is significantly curbed. To meet transportation electrification goals, the Vermont Pathways model demonstrates that 970 EVs and plug-in hybrid electric vehicles (PHEVs) will be necessary by 2025 (Table 7). The light duty truck target is 937 vehicles by 2025. EV registration data from Drive Electric for all categories of vehicles show that in 2023, there were a total of 933 EV and PHEV vehicles registered in the Windham Region. The EV registrations need to maintain this rate of growth in order to meet our 2025 target.
While electric vehicles have zero tailpipe emissions (assuming a net-zero electricity source), they still have lifecycle carbon costs associated with their manufacturing and use. From a climate pollution and land use planning perspective, incentivizing a shift away from private automobile use is the most effective way to link climate, energy, and transportation planning goals. However, the Windham Region is highly rural, and pursuing strategies to encourage the adoption of electric vehicles is necessary, given the ubiquity of car ownership. Education, outreach, regional collaboration, and public-private partnership are critical here. Many organizations provide incentives and rebates to residents looking to adopt an electric vehicle or install charging equipment, including VTrans, Green Mountain Power, and Charge Vermont. Organizations like Drive Electric play a crucial role in educating citizens about electric vehicle technology while connecting residents, business owners, and municipalities with financing options. To achieve the ambitious targets outlined below, the programs mentioned above must be broadly advertised through continuous public outreach and inter-organizational collaboration.
TABLE 7: REGIONAL TRANSPORTATION TARGETS FOR USE OF RENEWABLES
|
Regional Passenger Car EV and PHEV Stock |
970 |
8,524 |
19,821 |
|
Regional Light Duty Truck EV and PHEV Stock |
937 |
11,994 |
24,250 |
|
Percentage of LDV Transportation Energy from Renewable Resources |
9% |
33% |
84% |
ELECTRICAL SECTOR: EFFICIENCY AND CONSERVATION TARGETS
It is challenging to derive electrical efficiency targets because the Vermont Pathways model assumes a rapid increase in electrical demand from fuel-switching in the thermal and transportation sectors. As a result, targets for electrical efficiency and conservation are determined separately using projections from the Public Service Department. PSD periodically publishes a Market Potential Study that estimates the potential for Vermont’s Energy Efficiency Utilities (EEU) to achieve efficiency savings in the electrical and natural gas sectors. The study also helps inform targets for the EEUs, which is relevant to the development of regional electrical efficiency targets and enhanced energy planning. The Public Service Department’s electrical efficiency data supplements the Vermont Pathways model and provides a proxy estimate for the amount of electrical demand embedded in it. Since the estimates are not from the model directly, there are not separate targets for the Baseline and CAP Mitigation Scenarios.
Electrical efficiency targets are expressed as the amount of cumulative electrical energy saved energy from EEU programs, or the total amount of MWh savings expected by a given target year. The 2022 EEU Market Potential Study provides targets focused from the saving from energy efficiency in appliances and equipment. These are then, disaggregated to the regional-level based on county population and the EEU’s geographic performance target.
TABLE 8: REGIONAL ELECTRICAL EFFICIENCY TARGETS FOR RESIDENTIAL AND NON-RESIDENTIAL BUILDINGS
ELECTRICAL SECTOR: RENEWABLE GENERATION TARGETS
The final set of targets for the electric sector are those for renewable generation. Renewable generation targets help quantify the rate of progress needed in the Region to support state climate goals and foster energy security and independence through the adoption of distributed generation technologies. In addition, target-setting presents an opportunity to plan for the deployment of renewable resources while critically assessing regional conditions, opportunities, and constraints related to renewable development.
Renewable generation targets come from the Public Service Department’s Generation Scenarios Tool. The tool uses electrical demand data from the Vermont Pathways model as an input into the target-setting exercise. From here, the statewide projected electrical demand for a given future year (like 2050) is disaggregated to the regional level based on an equal proportion of regional land area and population. Regions are then responsible for determining the percentage of this future electrical demand that should be met with renewable resources. Table 9 shows the renewable generation targets for the Windham Region for 2025, 2035, and 2050. These targets represent the amount of in-region renewable energy needed to meet 25% of forecasted electrical energy demand, according to the Generation Scenarios Tool
TABLE 9: : REGIONAL RENEWABLE ENERGY GENERATION TARGETS
|
|
2025 Targets |
2035 Targets |
2050 Targets |
|||
|
Renewable Generation Capacity Targets (MW) |
96.6 |
143.3 |
186.9 |
|||
|
Annual Renewable Electricity Production Targets (MWh) |
135,786 |
201,407 |
262,763 |
|||
The Windham Region’s 25% in-region capacity target for 2050 is 186.9 MW, and its annual electricity production target is 262,763 MWh. As of 2024, the Windham Region has an installed renewable generation capacity of 189.4 MW and is estimated to generate 623,819 MWh of renewable energy annually. Given this, it is fair to say that the Windham Region is already meeting its baseline renewable generation target for 2050. Nevertheless, the Region supports the continued siting and deployment of renewable technologies to further contribute to state energy goals and encourage the numerous localized benefits of distributed renewable generation.
Much of the energy currently generated in the Region comes from hydroelectric dams on the Connecticut and Deerfield Rivers. The Windham Region is fortunate to benefit from powerful hydrologic resources that allow for substantial in-region energy generation. Very few regions have a similar abundance of these same resources, meaning that the Windham Region has a distinct obligation to support other areas of Vermont that lack the same renewable resource endowment. More coordination between energy planning partners, including utilities, regional planning commissions, and the Public Service Department, should be pursued to organize efforts across and between regions on this front.
GENERATION POTENTIAL
The Region’s potential for new energy generation was determined using resource availability data from the Act 174 mapping exercise. The mapping analysis identified areas with sufficient resource abundance (like solar radiation or wind speed) to accommodate generation, and precluded areas that have known or possible environmental constraints (see “Land Use and Siting” section below for further context). According to the mapping exercise, the Region has 45,816 acres with prime resource availability for solar (no known siting constraints) and 136,971 acres with secondary resource availability (no known constraints but at least one possible constraint). For wind, WRC maps indicate that there are 59,327 acres of prime resource lands available for 30 meter hub height wind, with an additional 204,875 acres of secondary resource lands.
The acreage values from the mapping exercise were then used to determine generation potential, which is the maximum build-out of renewables under environmental constraints and conditions. Table 10 shows the energy generation potential of every town in the Region in MWh. The results from this exercise indicate that there is significant land available for the development of renewable resources in the Region. Even though the Region is currently exceeding its baseline 2050 generation target, the generation potential analysis shows the extent to which further progress can be made in this area.
For a full description of the of the methods used to determine generation potential, refer to Appendix B of the Energy Chapter.
TABLE 10: REGIONAL RENEWABLE ENERGY GENERATION POTENTIAL
|
Town |
Rooftop Solar (MWh) |
Ground-Mounted Solar (MWh) |
Wind (MWh) |
|
Athens |
1,316 |
51,608 |
288,802 |
|
Brattleboro |
95,338 |
315,600 |
241,969 |
|
Brookline |
2,071 |
63,754 |
180,169 |
|
Dover |
27,052 |
599,528 |
1,199,801 |
|
Dummerston |
11,239 |
269,497 |
125,763 |
|
Grafton |
5,938 |
156,668 |
855,760 |
|
Guilford |
10,035 |
214,867 |
479,011 |
|
Halifax |
5,338 |
609,157 |
1,079,067 |
|
Jamaica |
6,444 |
543,304 |
985,012 |
|
Londonderry |
15,707 |
855,542 |
262,931 |
|
Marlboro |
6,150 |
775,282 |
1,548,342 |
|
Newfane |
6,698 |
265,462 |
540,946 |
|
Putney |
13,966 |
278,289 |
125,067 |
|
Readsboro |
5,121 |
280,452 |
1,365,759 |
|
Rockingham |
27,015 |
249,483 |
209,818 |
|
Searsburg |
958 |
81,769 |
764,553 |
|
Somerset |
71 |
187,774 |
892,050 |
|
Stratton |
12,321 |
436,892 |
1,773,192 |
|
Townshend |
7,548 |
171,854 |
730,775 |
|
Vernon |
15,713 |
113,831 |
26,426 |
|
Wardsboro |
4,702 |
375,646 |
892,318 |
|
Westminster |
22,592 |
394,582 |
410,248 |
|
Weston |
6,255 |
739,539 |
628,010 |
|
Whitingham |
10,320 |
907,575 |
1,397,482 |
|
Wilmington |
23,048 |
1,025,608 |
1,615,344 |
|
Windham |
2,728 |
153,533 |
921,120 |
|
Winhall |
15,695 |
407,986 |
1,289,990 |
|
REGIONAL TOTAL |
361,379 |
10,525,080 |
20,829,724 |
Biogeneration
Biomass is unique from other renewable energy generation technologies as the generation capacity is not inextricably linked to the site. Biomass resources are harvested from a location and then transported to a generation facility. There are no electricity generating wood fired plants in the Windham Region. As of January 2024, there are 4 biomass generation projects that produce 15,220 MWh annually.
Approximately 472,000 acres (82%) of the Windham Region is forested. The region’s forestry industry is one of the state’s leading producers, especially of high-quality northern hardwoods and white pine. Windham County also has the most standing timber, 3.46 billion board feet, in the State. This yields well over 100,000 green tons of low-grade wood material. With the forests producing significantly more than what is being harvested, this number is projected to increase in the future. Seventy-two percent of the region’s forests are in private, non-industrial ownership, with industrial firms and Federal, State and local governments sharing the rest
The Region could be ideal as a hub for biomass usage and generation by tapping into this abundant resource and applying it to the heating sector. Through incentives offered by the State of Vermont, and a program called Windham Wood Heat that was administered through WRC between 2015 – 2022, many schools and public serving institutions converted to advanced wood heating.
Environmental impacts must also be considered with biomass power. The combustion of wood produces heat and emissions including hazardous air pollutants (HAPs), fine particle pollution (ash), and volatile organic compounds (VOC). The pollutant of greatest concern to human health is fine particles (10 microns or less in diameter), which may be inhaled and cause a number of respiratory illnesses. Several other emissions are also of concern to air and water quality, including carbon monoxide (CO), carbon dioxide (CO2), sulfur oxides (SOx), and nitrogen oxides (NOx). Emissions of NOx (if kept below 1,300 Celsius) and SOx from burning wood are significantly lower than coal and petroleum and are comparable to those of natural gas. Particulate levels in wood emissions are similar to those from burning coal and petroleum and substantially higher than the levels in the emissions from natural gas. Particulate emissions can be controlled to acceptable levels with smoke stack equipment such as scrubbers, bag filters, and electrostatic precipitators; however, this equipment is only cost effective on large commercial-sized combustion systems. Particulate emissions from smaller equipment, especially residential-sized units can be a concern.[2]
The CO2 in wood combustion emissions is considered by some to be “carbon-neutral” because it is basically equivalent to the amount of CO2 trees need to grow the same quantity of wood. Hence the combustion of wood does not contribute to the net increase in atmospheric levels of CO2 (a greenhouse gas) as does the combustion of fossil fuels. However, because this concept is not universally accepted, the impacts of this power source must be considered as carefully as those of other combustion fuel sources.
In addition to biomass, there are 4 methane sites in the Windham Region. These include the Brattleboro Waste Water Treatment Plant, the Windham Solid Waste Management District landfill, Westminster Farms, and Miller Farm. One of the nation's first commercial landfill gas to electricity projects was constructed in Brattleboro in 1982. Vermont Energy Recovery Systems uses the methane produced at the Windham Solid Waste Management District's Brattleboro landfill to generate and sell electricity to Green Mountain Power.
Methane is also emitted from volatile solids or animal waste. Anaerobic digesters produce electricity from the methane recovered from cow manure and/or other organic matter. In addition to producing energy and reducing the amount of methane emitted into the atmosphere, this process also reduces water pollution and produces a high-quality fertilizer as a by-product. Westminster Farms, Inc. was the first of this category in the Region.
HYDRO
Hydroelectric power accounted for approximately 2.35% of the total energy consumed in Vermont in 2022[3]. Most hydropower is generated or purchased by Vermont Utilities for Vermont’s electricity needs. Hydropower accounts for 36% of the electricity mix and is the largest portion of the renewable energy portfolio of Vermont utilities. Hydro power is sourced from Hydro Quebec and smaller, privately owned facilities that exist around the region. In the Windham Region, there are 7 hydro facilities that produce 484,651 MWh, which means that hydropower represents the largest share of the Region’s current renewable mix.
The major supplier of hydropower for Vermont is Hydro Québec (HQ), a Canadian company. In 2010, 20 Vermont utilities signed a 26-year power contract with HQ to purchase up to 225 MW of electricity from January 2012 through 2038. In addition, HQ and the Vermont utilities agreed to share any future revenues related to environmental attributes of HQ power generation flowing into Vermont.[4]
In 2022 Hydro Quebec purchased the hydro-electric dams along the Connecticut and Deerfield Rivers in Vermont and New Hampshire from Great River Hydro, LLC. In the Windham Region, Hydro Quebec (still operating under the name Great River Hydro) operates hydroelectric stations and associated storage reservoirs and dams on the Connecticut and Deerfield Rivers. The Bellows Falls Dam and Vernon Dam are located on the Connecticut River. The Bellows Falls Dam and has a generating capacity of 49 MW. The Vernon Dam is the oldest dam, in service since 1909, and has a generating capacity of 37 MW. The Searsburg Dam and Station, located on the Deerfield River, is rated at 5 MW. The Harriman Dam and Station, located in Wilmington and Whitingham, includes three generating units capable of producing 41 MW of electric power. Sherman Reservoir lies mostly in Vermont but its electric generation occurs in Massachusetts, with a capacity of 6 MW.
All hydro facilities of significant size are licensed by the Federal Energy Regulatory Commission (FERC). New projects may also require a permit from the U.S. Army Corps of Engineers. These federal permits trigger state review delegated under the federal Clean Water Act. The FERC permitting process can take two to seven years to complete. Periodically these plants have to renew their licenses. Generally, the re-licensing process results in permit conditions that require plant owners to sacrifice some operating flexibility in order to mitigate the environmental impacts of their facilities. For some hydro facilities, this has resulted in a 10 to 20 percent loss of energy production.[5]
The current licenses for each of the Wilder, Bellows Falls, and the Vernon Hydroelectric Projects (TransCanada) and the Turners Falls Hydroelectric Project and Northfield Mountain Pumped Storage Project (FirstLight) expired in 2018. All projects utilize water from the Connecticut River to generate hydroelectric power. The licenses were issued by the FERC for terms of 30 to 50 years. TransCanada and FirstLight are currently working on relicensing process for these dams using FERC’s Integrated Licensing Process (ILP).
According to assessments completed by the State, it is clear that the best hydropower sites have already been developed. There are very few undeveloped sites that could support capacity greater than 1 MW, and relatively few in the 500 kW to 1 MW range. There are many potential smaller community and residential-scale sites sized below 200 kW. Incentives such as net metering, group net metering, and the Standard Offer Program are necessary to facilitate the development of smaller sites.
According to the ANR, the hydro resource is already heavily developed in Vermont. Further development would likely result in intermittent manipulation of stream flows and water levels, a possible increase in flood hazards resulting from the disruption of natural river processes, some loss of riverine aquatic habitat, and barriers to movement of fish and other aquatic life. ANR’s 2008 Report The Development of Small Hydroelectric Projects in Vermont identified the following criteria as necessary for any new hydroelectric generator to have acceptable environmental impacts: :
- No new dam or other barrier to aquatic organism movement and sediment transport.
- Run-of-river operation.
- Bypass flows necessary to protect aquatic habitat, provide for aquatic organism passage, and support aesthetics.
- Fish passage where appropriate.
- No change in the elevation of an existing impoundment or in water level management.
- No degradation of water quality, particularly with respect to dissolved oxygen, temperature, and turbidity.
- No change in the upstream or downstream flood profile or fluvial erosion hazard.
Because there are few undeveloped sites that are candidates for new hydroelectric plants, three effective ways to increase capacity by improving efficiency and output at existing hydroelectric facilities include: installing more efficient turbines, installing small turbines at the dams that utilize bypass flows, and installing new turbines that can operate efficiently over a wider range of flows. These upgrades are often possible without changing current operating requirements, i.e., power production can be increased without additional environmental impacts. In addition, existing municipal water supply and wastewater treatment pipelines could capture the energy in these systems by installing hydro turbines to the pipelines without otherwise altering the regular operation of the system. Such in-pipe hydroelectric systems have minimal environmental impact.
SOLAR
As of 2023, the Public Service Department reports that 10.2% of the energy purchased or generated by Vermont utilities comes from photovoltaic (PV) solar (before Renewable Energy Credit retirements,) and that 4% of the State’s electric power mix comes from PV solar (after Renewable Energy Credit retirements). Solar energy can be used either to generate electricity or to generate heat. For 2024, it is estimated that solar installations in the Region generate 52,870 MWh of electricity, with 36,450 MWh coming from 15 kW and larger sites.[6] The Region posses 40.2 MW of installed PV capacity, meaning that solar accounts for 21% of our capacity mix.
In 1998, the Legislature enacted a Net Metering law (30 V.S.A. § 219a) requiring electric utilities to permit customers to generate their own power using small-scale renewable energy systems of 15 kW or less. The excess power generated by these systems can be fed back to the utility, basically running the electric meters backwards. The law has been amended multiple times, but still continues to be an important tool in residential solar installations. According the Vermont Public Service Department, as of January 2024 the Windham Region had a total of 1,298 net-metered sites and 24,715.47 kW of installed capacity.[7] The region also had two non-net metered sites with a capacity of 4,160kW.
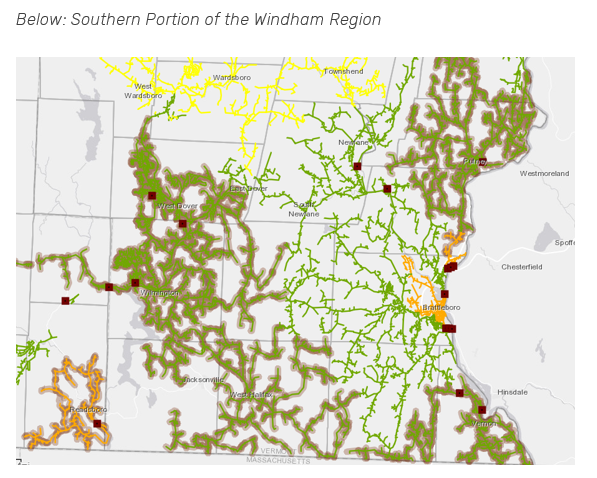
As the demand to install solar on residential and commercial properties increase, the electric grid at its current capacity can handle the increase to varying degrees depending on availability of appropriate transmission lines and the capacity of substations. Green Mountain Power created an interactive Solar Map in an effort to help Vermonters generate power closer to where it is needed to increase reliability and costs. The map allows Vermonters to see where solar energy is being generated and how it ties into the grid.
FIGURE 19: GREEN MOUNTAIN SOLAR HOSTING CAPACITY MAPS
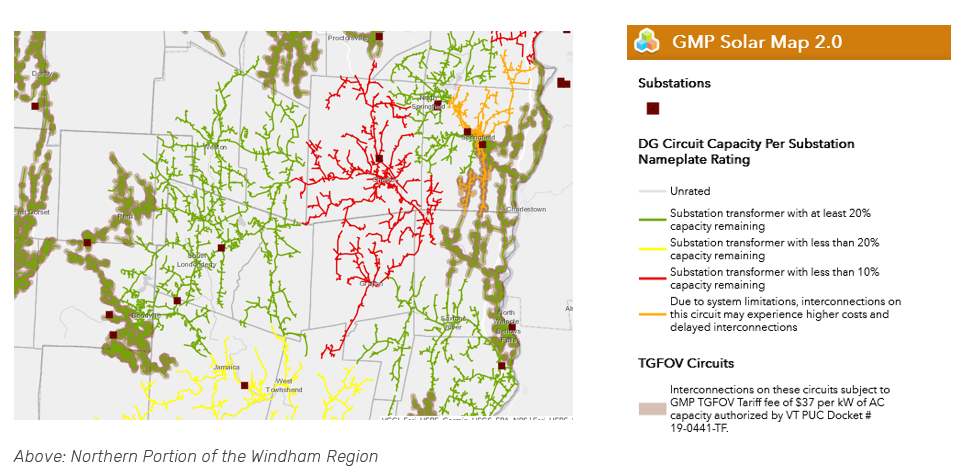
GMP has created a color system to show Vermonters where capacity for new solar is abundant and where the grid is at or approaching capacity. The map itself is meant to help educate Vermonters about projects across the state and their impact on the grid system.
A potential drawback of PV (solar) power is cost. When compared to the current market price forecast for electricity, the price of PV remains high. There is data that suggests that state and federal incentives have served as major drivers in the rate of solar facilities installation. Despite cost issues, PV power has several advantages that make it a power source that the state should continue to support. PV is largely a peak electric load–following resource, meaning that during peak summer loads, the PV systems are at their highest production, resulting in peak shaving and grid reliability benefits. In addition, PV power is generated without noise, requires low levels of maintenance, emits no pollution, and is extremely distributable.
While there is currently relatively little controversy about solar energy as a source of power, potential conflicts arise with the siting of solar installations. Ground-mounted systems tend to be larger in scale that roof mounted systems, and generally are sited on undeveloped or agricultural land. Depending on placement, solar fields can have negative impacts on forest connectivity and prime agricultural fields. Complaints have arisen about aesthetics and the panels interrupting the scenic quality of an area. Installations covering large acreage should not only deem a project suitable based on solar capacity, but should evaluate the impacts that the installation has on the natural resources and historic settings of the site. In some cases, the installation should provide mitigation in the form of retained agricultural soils or forested patches on site or conserved agricultural or forest land of equal value elsewhere in the region. Roof top systems have the advantage of requiring zero additional development of open land, though conflicts can arise if these systems are installed in areas with historic district overlays, or where neighboring trees may shade out the system for a substantial period of the day. Towns should consider these issues and address them in their plans and zoning bylaws.
WIND
Wind energy is categorized by the Energy Information Administration (EIA) as an “other renewable,” a category that provided about 1.7% of the energy used in Vermont in 2022.[8] Wind energy is used primarily to generate electricity, but not as a source for heat. As of 2019, the Windham Region had 14 wind generation projects with a total annual production of 71,078 MWh.
In 1997, Green Mountain Power developed Vermont’s first modern, commercial wind-generating station in Searsburg, consisting of 11 turbines with combined total power rating of 6 MW. The Vermont Public Service Board approved the project, despite its relatively high cost due to its perceived value as a demonstration project. In 2009, the Public Service Board (now known as the Vermont Public Utility Commission) granted a Certificate of Public Good permitting Deerfield Wind to construct a 30 MW facility, consisting of 15 wind turbines, in Searsburg and Readsboro.
Small-scale, net metered installations that serve homes, businesses, and communities are also located throughout the region. Small-scale wind facilities are most often represented by a single turbine, which can generate from less than 1 kW up to 100 kW for a small commercial machine. A number of factors affect the success of a small wind project. To harness the best wind spectrum, turbine siting is absolutely critical within the microclimate of the landscape. Turbines must be positioned so they extend as high as possible above obstacles like trees. Technical expertise to maintain the system is also essential. As of January 2024, there were a total of 8 net metered wind facilities, and 1 non-net metered, in the region with a combined capacity of 2,320 kW.
Wind power is considered a complement to solar in a renewable energy portfolio. When solar power is low or unavailable, during cloudy days or at night, the wind is often more potent. For example, during Vermont’s winter, when sunlight is diminished, average wind speeds measure at their annual high. Wind power is intermittent in nature, like many other renewable sources of power; thus, resource planning for effective power grid integration is essential.
Wind power is clean and renewable, but turbine placement can be difficult and controversial because of natural resource impacts, aesthetics, noise, and the need for turbine placement elevations between 2,500-3,300 feet, locations in Vermont that tend to be sensitive with thin soils and steep slopes. The windiest areas in the region are most often on the higher-elevation ridgelines that are sensitive habitats for plants and wildlife, and are the source of the region’s most pristine headwaters. In areas where road access does not exist, new permanent roads must be built to service the wind facility. Other potentially negative environmental impacts include bird and bat mortality, habitat disruption and fragmentation, erosion, pollution from facility maintenance, turbine noise, and visual flicker.
[1] Drive Electric: Vermont EV Registrations by Municipality as of Jan 2024, 2024. https://veic.maps.arcgis.com/apps/mapviewer/index.html?webmap=7a62de8f69954804889c86a12a9640c8
[2] Extension, http://www.extension.org/pages/43735/what-are-the-air-emissions-of-burning-wood
[3] US Energy Information Administration Vermont State Energy Profile. 2022 Vermont Energy Consumption Estimates. https://www.eia.gov/state/print.php?sid=VT
[4] Vermont Department of Public Service, Biennial Report July 1, 2006 - June 30, 2010, July 2011, http://publicservice.vermont.gov/sites/psd/files/Pubs_Plans_Reports/Biennial_Reports/2010%20Biennial%20-%20Publication%20Draft.pdf
[5] Vermont Department of Public Service, Biennial Report July 1, 2006 - June 30, 2010, July 2011, http://publicservice.vermont.gov/sites/psd/files/Pubs_Plans_Reports/Biennial_Reports/2010%20Biennial%20-%20Publication%20Draft.pdf
[6] Estimate derived from Public Service Department data on distributed photovoltaic solar generation in Vermont.
[7] Data Source: Public Service Department list of renewable distributed generation in Vermont (<5MW). Distributed to RPC’s in January 2024.
[8] US Energy Information Administration: Vermont State Energy Profile. Based on Vermont Energy Consumption Estimates for 2022. https://www.eia.gov/state/print.php?sid=VT